Join us at the 2025 Microsoft Fabric Community Conference
March 31 - April 2, 2025, in Las Vegas, Nevada. Use code MSCUST for a $150 discount! Early bird discount ends December 31.
Register Now- Power BI forums
- Get Help with Power BI
- Desktop
- Service
- Report Server
- Power Query
- Mobile Apps
- Developer
- DAX Commands and Tips
- Custom Visuals Development Discussion
- Health and Life Sciences
- Power BI Spanish forums
- Translated Spanish Desktop
- Training and Consulting
- Instructor Led Training
- Dashboard in a Day for Women, by Women
- Galleries
- Community Connections & How-To Videos
- COVID-19 Data Stories Gallery
- Themes Gallery
- Data Stories Gallery
- R Script Showcase
- Webinars and Video Gallery
- Quick Measures Gallery
- 2021 MSBizAppsSummit Gallery
- 2020 MSBizAppsSummit Gallery
- 2019 MSBizAppsSummit Gallery
- Events
- Ideas
- Custom Visuals Ideas
- Issues
- Issues
- Events
- Upcoming Events
Be one of the first to start using Fabric Databases. View on-demand sessions with database experts and the Microsoft product team to learn just how easy it is to get started. Watch now
- Power BI forums
- Forums
- Get Help with Power BI
- Desktop
- Re: Counting Active Ticket numbers by group
- Subscribe to RSS Feed
- Mark Topic as New
- Mark Topic as Read
- Float this Topic for Current User
- Bookmark
- Subscribe
- Printer Friendly Page
- Mark as New
- Bookmark
- Subscribe
- Mute
- Subscribe to RSS Feed
- Permalink
- Report Inappropriate Content
Counting Active Ticket numbers by group
Hello, I am working on a solution that looks at active ticket numbers for different groups in my organization. My original Data set looks like this.
| Ticket Number | State | Created | Resolved | Group |
| 1 | Resolved | 11/06/23 | 11/06/23 | Group1 |
| 2 | Resolved | 11/06/23 | 11/07/23 | Group2 |
| 3 | Resolved | 11/07/23 | 11/07/23 | Group1 |
| 4 | New | 11/08/23 | Group2 | |
| 5 | New | 11/09/23 | Group3 |
I created a table in powerbi that is basically a list of these created and resolved tickets that looks like this.
| Ticket | Attribute | Date |
| 1 | Created | 11/06/23 |
| 1 | Resolved | 11/06/23 |
| 2 | Created | 11/06/23 |
| 2 | Resolved | 11/07/23 |
| 3 | Created | 11/07/23 |
| 3 | Resolved | 11/07/23 |
| 4 | Created | 11/08/23 |
| 5 | Created | 11/09/23 |
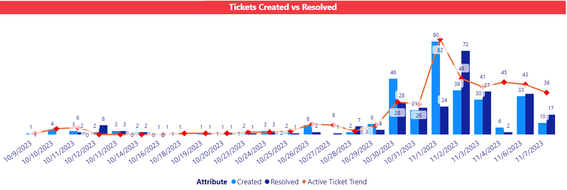
The purpose of that was to build the following visual.
Problem Statement: Now what I am hoping to do is to create a stacked bar chart with a line that shows each of my group's active tickets that sum up to the "Active Ticket Trend" Line (The line that shows the cumulative number of active tickets) for each day. So that I know the breakdown of active tickets per group for every day.
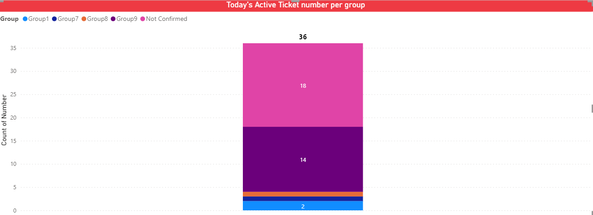
I currently am able to show today's active ticket number per group by using some simple filtering (shown below), but I want to be able to do this for every day in the past that has active tickets.
I tried creating a relationship between the ticket numbers in my 2 tables and adding the [group] column, but that is not working.
I would really appreciate any help to achieve this solution. Please let me know if you have any questions or want some additional explanation. I have a link to the powerBI document and excel source data I am using for this.
Here is a link to the powerbi file and source data.
Link: https://drive.google.com/drive/folders/1kWEEEP8iIiPmDeXkye3W38EsWMrAZvt0?usp=sharing
I greatly appreciate your time and help - thank you!
-Tim
Solved! Go to Solution.
- Mark as New
- Bookmark
- Subscribe
- Mute
- Subscribe to RSS Feed
- Permalink
- Report Inappropriate Content
Hi @tcburge3 ,
You can try using the following dax.
Measure 1 =
var _columnnumber=
SELECTCOLUMNS(
    FILTER(ALL('Ticket Trend'),
    'Ticket Trend'[Date]=MAX('Ticket Trend'[Date])),"Number",'Ticket Trend'[Number])
var _count=
COUNTX(
    FILTER(ALLSELECTED('Current Incidents'),
    'Current Incidents'[Number] in _columnnumber&&'Current Incidents'[xActive]=1),
    'Current Incidents'[Number])
return
_count
Measure 2 =
SUMX(
FILTER(ALLSELECTED('Ticket Trend'),
'Ticket Trend'[Date]<=MAX('Ticket Trend'[Date]) ),[Measure 1])
Best Regards,
Liu Yang
If this post helps, then please consider Accept it as the solution to help the other members find it more quickly.
- Mark as New
- Bookmark
- Subscribe
- Mute
- Subscribe to RSS Feed
- Permalink
- Report Inappropriate Content
I added my powerbi file and the source data in the link. Is there anything else I need to include to get some help on this?
Helpful resources

Join us at the Microsoft Fabric Community Conference
March 31 - April 2, 2025, in Las Vegas, Nevada. Use code MSCUST for a $150 discount!

Microsoft Fabric Community Conference 2025
Arun Ulag shares exciting details about the Microsoft Fabric Conference 2025, which will be held in Las Vegas, NV.

| User | Count |
|---|---|
| 114 | |
| 76 | |
| 57 | |
| 52 | |
| 44 |
| User | Count |
|---|---|
| 168 | |
| 116 | |
| 63 | |
| 57 | |
| 50 |


