Get certified for free when you join Fabric Data Days 2026 and dive into Fabric, Power BI, SQL, AI, and other essential data skills.
Join nowJuly 7 - July 17 | Round 2 of the Power BI Dataviz World Championships. Don't miss your chance! Learn more
How can I create two column charts based on usage logging that shows the growth of users? I have the username and timestamp (among other metrics).
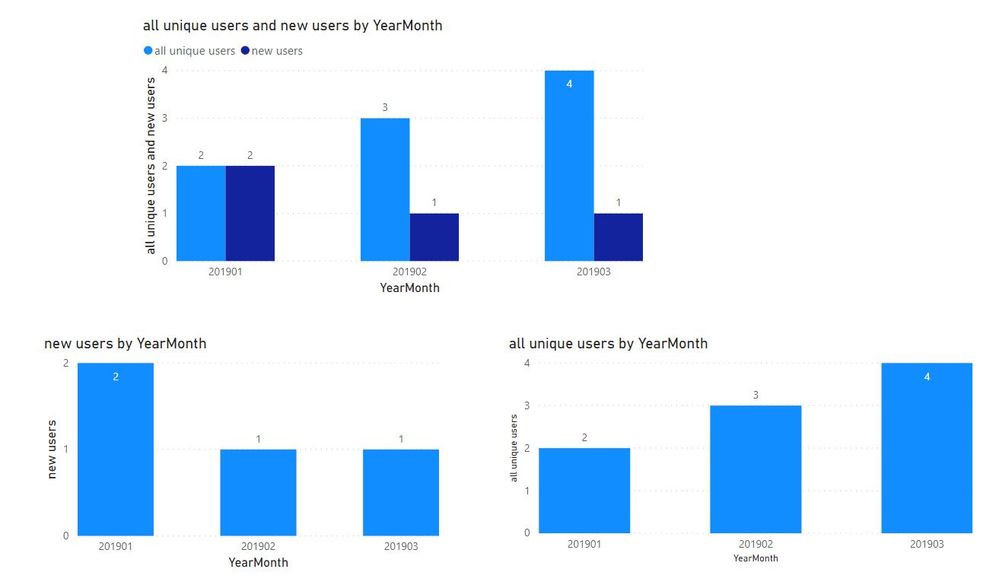
I want one chart to show the number of users that's never been seen before (new users), and one that shows the accumulated user count (all unique users).
Date, username
2019-01-01, user1
2019-01-01, user1
2019-01-24, user2 -- Two new users in Jan
2019-02-11, user1
2019-02-17, user3
2019-02-11, user2 -- Three unique, but only one new user i Feb
2019-03-05, user4 -- One new user i Mar
and so on...
Chart1, new users per month:
|
| | |
-----------------
j f m...
Chart2, total unique users:
|
| |
| | |
| | |
-----------------
j f m...
Thanks!
Solved! Go to Solution.
hi @Anonymous
You could try this way as below:
Step1:
Add a YearMonth column for date column
Step2:
Use these two formula to create two measure for your requirement:
new users = CALCULATE(DISTINCTCOUNT('Table'[username]),FILTER('Table','Table'[Date]=CALCULATE(MIN('Table'[Date]),ALLEXCEPT('Table','Table'[username]))))all unique users = CALCULATE(DISTINCTCOUNT('Table'[username]),FILTER(ALL('Table'),'Table'[Date]<=MAX('Table'[Date])))
Result:
and here is sample pbix file, please try it.
Regards,
Lin
hi @Anonymous
You could try this way as below:
Step1:
Add a YearMonth column for date column
Step2:
Use these two formula to create two measure for your requirement:
new users = CALCULATE(DISTINCTCOUNT('Table'[username]),FILTER('Table','Table'[Date]=CALCULATE(MIN('Table'[Date]),ALLEXCEPT('Table','Table'[username]))))all unique users = CALCULATE(DISTINCTCOUNT('Table'[username]),FILTER(ALL('Table'),'Table'[Date]<=MAX('Table'[Date])))
Result:
and here is sample pbix file, please try it.
Regards,
Lin
Thank you so much! Works perfectly.
But your measure formulas needed to be adjusted to use semicolons instead of commas to get it to work. Maybe it's some internationalization setting, but it threw me off for a minute (the attached file helped a lot!).
Join us in Barcelona for FabCon and SQLCon, the Fabric, Power BI, SQL, and AI community event. Save €200 with code FABCMTY200.
Join Data Days 2026: 60 days of free live/on-demand sessions, challenges, study groups, and certification opportunities.
| User | Count |
|---|---|
| 28 | |
| 23 | |
| 18 | |
| 18 | |
| 15 |
| User | Count |
|---|---|
| 51 | |
| 44 | |
| 43 | |
| 39 | |
| 32 |