- Power BI forums
- Updates
- News & Announcements
- Get Help with Power BI
- Desktop
- Service
- Report Server
- Power Query
- Mobile Apps
- Developer
- DAX Commands and Tips
- Custom Visuals Development Discussion
- Health and Life Sciences
- Power BI Spanish forums
- Translated Spanish Desktop
- Power Platform Integration - Better Together!
- Power Platform Integrations (Read-only)
- Power Platform and Dynamics 365 Integrations (Read-only)
- Training and Consulting
- Instructor Led Training
- Dashboard in a Day for Women, by Women
- Galleries
- Community Connections & How-To Videos
- COVID-19 Data Stories Gallery
- Themes Gallery
- Data Stories Gallery
- R Script Showcase
- Webinars and Video Gallery
- Quick Measures Gallery
- 2021 MSBizAppsSummit Gallery
- 2020 MSBizAppsSummit Gallery
- 2019 MSBizAppsSummit Gallery
- Events
- Ideas
- Custom Visuals Ideas
- Issues
- Issues
- Events
- Upcoming Events
- Community Blog
- Power BI Community Blog
- Custom Visuals Community Blog
- Community Support
- Community Accounts & Registration
- Using the Community
- Community Feedback
Register now to learn Fabric in free live sessions led by the best Microsoft experts. From Apr 16 to May 9, in English and Spanish.
- Power BI forums
- Forums
- Get Help with Power BI
- Desktop
- Re: Count Rows from Table VISUAL
- Subscribe to RSS Feed
- Mark Topic as New
- Mark Topic as Read
- Float this Topic for Current User
- Bookmark
- Subscribe
- Printer Friendly Page
- Mark as New
- Bookmark
- Subscribe
- Mute
- Subscribe to RSS Feed
- Permalink
- Report Inappropriate Content
Count Rows from Table VISUAL
Hello,
I have a table VISUAL in power bi that lists 8 people, for example. So the total rows is 8.
*Note this is not my data table, but a VISUAL table that has a number of filters on it*
I want a way to display this number in a card so that underneath the table, i can display the total number of people that meet the criteria to belong in this table.
Find it so bizzare that something so simple seems difficult to find the answer to.
--------------------------------------
Another way I could achieve this also is by writing a measure, however I have not been successful in this.
For example, I need a measure that shows distinct names, then only have the names where the SUM OF data usage is equal to 0, and when the invoice date is November, December, January. If a measure could be written, i'm certain that will also give me the number I'm looking for if i put that into a card visual.
Any help would be massively appreciated.
Thanks,
Josh
- Mark as New
- Bookmark
- Subscribe
- Mute
- Subscribe to RSS Feed
- Permalink
- Report Inappropriate Content
Thanks
- Mark as New
- Bookmark
- Subscribe
- Mute
- Subscribe to RSS Feed
- Permalink
- Report Inappropriate Content
Hi,
Write these measures
Total = sum(Data[Usage])
Count = countrows(filter(values(Data[Name]),[Total]=0))
Select Nov, Dec, Jan in the slicer/filter.
Hope this helps.
Regards,
Ashish Mathur
http://www.ashishmathur.com
https://www.linkedin.com/in/excelenthusiasts/
- Mark as New
- Bookmark
- Subscribe
- Mute
- Subscribe to RSS Feed
- Permalink
- Report Inappropriate Content
Hi @JoshP11
The info you are providing is confusing because what you say you are doing and what you show you are doing are different.
Example: you say you are filtering for data Volume = 0 but you are actually filtering for Data Volume > 15000.
I'm not sure how you are storing/using dates either. Are they actual dates or text? Are you using a Date Table?
Please supply some real sample data.
Regards
Phil
Did I answer your question? Then please mark my post as the solution.
If I helped you, click on the Thumbs Up to give Kudos.
Blog :: YouTube Channel :: Connect on Linkedin
Proud to be a Super User!
- Mark as New
- Bookmark
- Subscribe
- Mute
- Subscribe to RSS Feed
- Permalink
- Report Inappropriate Content
Hi @JoshP11
Please try this:
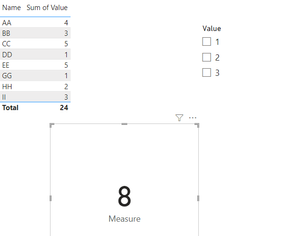
First of all, I create a set of sample:
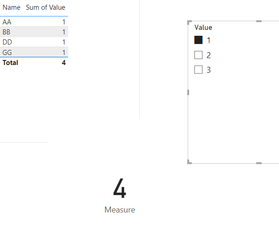
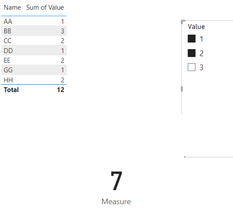
Then add a table visual:
Next add a measure:
Measure = COUNTROWS(VALUES('Table'[Name]))And create a card with this visual, the result is as follow:
Best Regards
Zhengdong Xu
If this post helps, then please consider Accept it as the solution to help the other members find it more quickly.
- Mark as New
- Bookmark
- Subscribe
- Mute
- Subscribe to RSS Feed
- Permalink
- Report Inappropriate Content
Hi Zhengdong,
Sorry I don't understand how this would work?
I have a table, like in your screenshots, I have name and then sum of data volume. But then I don't understand how that measure would work here?
I created the measure but then when I add it to a card visual, it shows 694 which is the total number of names in my base data, however I want the total names in the table, which should be 8?
Have i missed something?
I tried adding a slicer like your screenshots as well and put it on zero, but the card visual doesn't update.
Thanks
Josh
- Mark as New
- Bookmark
- Subscribe
- Mute
- Subscribe to RSS Feed
- Permalink
- Report Inappropriate Content
Hi @JoshP11
The Values() function returns the distinct values, so the countrow() function can get the right outcome.
But I don't know what the reason that cause the issue.
Could you please provide more raw data in your tables (exclude sensitive data), so that we can help you better.
Best Regards
Zhengdong Xu
If this post helps, then please consider Accept it as the solution to help the other members find it more quickly.
- Mark as New
- Bookmark
- Subscribe
- Mute
- Subscribe to RSS Feed
- Permalink
- Report Inappropriate Content
Hi Josh,
If you could supply some sample data that would help.
How are you getting the rows in the table visual? From a measure? Just from the base data aggregations?
Typically you could do this by countign the total number of rows in the data table and subtracting the number of rows in the visual. But I need to see your data/code to write any meaningful code for you.
regards
Phil
Did I answer your question? Then please mark my post as the solution.
If I helped you, click on the Thumbs Up to give Kudos.
Blog :: YouTube Channel :: Connect on Linkedin
Proud to be a Super User!
- Mark as New
- Bookmark
- Subscribe
- Mute
- Subscribe to RSS Feed
- Permalink
- Report Inappropriate Content
Hi Phil - thanks for responding!
So I'm getting the rows from the base data. I'm dragging in 'Name' and 'Data Volume'. Then I'm putting on some filters. The first filter is that Data Volume is equal to 0 and the second filter is the Invoice Period, and I'm selecitng the past 3 months. With that, returns 8 rows.
I have other tables all set up the same way, but checking for different data volumes (see below).
Then ideally I want a card visual to display the total distinct rows (or names) from the table visual.
Helpful resources

Microsoft Fabric Learn Together
Covering the world! 9:00-10:30 AM Sydney, 4:00-5:30 PM CET (Paris/Berlin), 7:00-8:30 PM Mexico City

Power BI Monthly Update - April 2024
Check out the April 2024 Power BI update to learn about new features.

| User | Count |
|---|---|
| 109 | |
| 101 | |
| 86 | |
| 77 | |
| 69 |
| User | Count |
|---|---|
| 120 | |
| 108 | |
| 98 | |
| 83 | |
| 77 |


