FabCon is coming to Atlanta
Join us at FabCon Atlanta from March 16 - 20, 2026, for the ultimate Fabric, Power BI, AI and SQL community-led event. Save $200 with code FABCOMM.
Register now!- Power BI forums
- Get Help with Power BI
- Desktop
- Service
- Report Server
- Power Query
- Mobile Apps
- Developer
- DAX Commands and Tips
- Custom Visuals Development Discussion
- Health and Life Sciences
- Power BI Spanish forums
- Translated Spanish Desktop
- Training and Consulting
- Instructor Led Training
- Dashboard in a Day for Women, by Women
- Galleries
- Data Stories Gallery
- Themes Gallery
- Contests Gallery
- QuickViz Gallery
- Quick Measures Gallery
- Visual Calculations Gallery
- Notebook Gallery
- Translytical Task Flow Gallery
- TMDL Gallery
- R Script Showcase
- Webinars and Video Gallery
- Ideas
- Custom Visuals Ideas (read-only)
- Issues
- Issues
- Events
- Upcoming Events
The Power BI Data Visualization World Championships is back! Get ahead of the game and start preparing now! Learn more
- Power BI forums
- Forums
- Get Help with Power BI
- Desktop
- Re: Conditional formatting on specific row in matr...
- Subscribe to RSS Feed
- Mark Topic as New
- Mark Topic as Read
- Float this Topic for Current User
- Bookmark
- Subscribe
- Printer Friendly Page
- Mark as New
- Bookmark
- Subscribe
- Mute
- Subscribe to RSS Feed
- Permalink
- Report Inappropriate Content
Conditional formatting on specific row in matrix based on the value in that row
Hi,
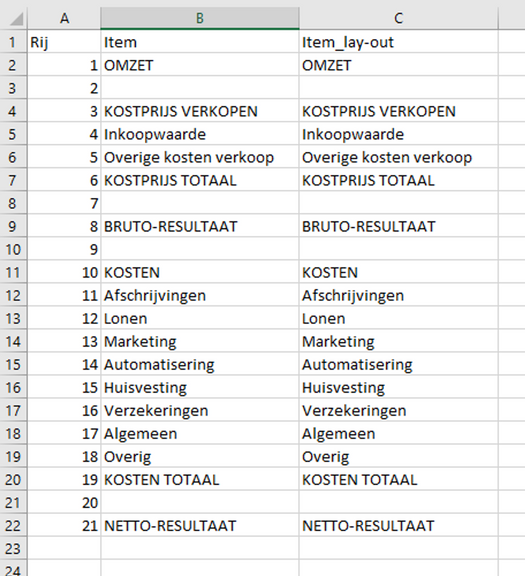
I've created a P&L statement in Power BI, by using a model in Excel and used that for a matrix table.
This is the model:
Then I created several measures. The measure that is added to the matrix is this one:
BEDRAGEN =
VAR KEUZE = SELECTEDVALUE('MODEL_RESREK'[Item])
Return
SWITCH(TRUE(),
KEUZE = "OMZET", [OMZET TOTAAL],
KEUZE = "KOSTPRIJS TOTAAL", [INKOOPWAARDE TOTAAL],
KEUZE = "BRUTO-RESULTAAT", [BRUTO-RESULTAAT],
KEUZE = "KOSTEN TOTAAL", [KOSTEN TOTAAL],
KEUZE = "NETTO-RESULTAAT", [NETTO-RESULTAAT],
CALCULATE(Meting[TOT_BEDRAGEN], FILTER(KOPPELING, KOPPELING[Sub-categorie]=keuze)))
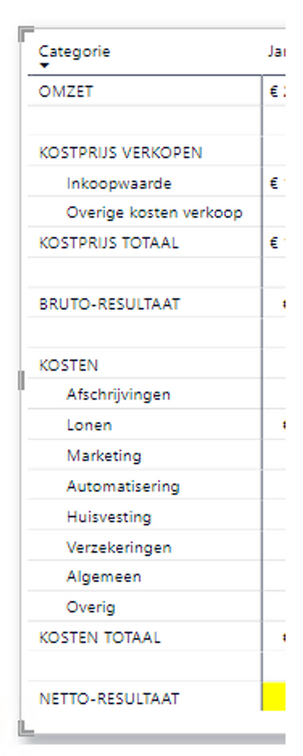
The matrix works:
Now for NETTO-RESULTAAT I want to conditionally format, where the background of a positive number is green and a negative number is red.
All I've managed so far is turning the entire row Yellow with this measure and then using it as a conditional formatting on BEDRAGEN:
color = if(max(MODEL_RESREK[Item_lay-out]) ="NETTO-RESULTAAT", "Yellow", "White")
So how do I get to the next step? Any help is very much appreciated.
Solved! Go to Solution.
- Mark as New
- Bookmark
- Subscribe
- Mute
- Subscribe to RSS Feed
- Permalink
- Report Inappropriate Content
Try:
color =
IF (
    AND ( MAX ( MODEL_RESREK[Item_lay-out] ) = "NETTO-RESULTAAT", [BEDRAGEN] < 0 ),
    "Red",
    IF (
        AND ( MAX ( MODEL_RESREK[Item_lay-out] ) = "NETTO-RESULTAAT", [BEDRAGEN] > 0 ),
        "Green",
        "White"
    )
)
Did I answer your question? Mark my post as a solution!
In doing so, you are also helping me. Thank you!
Proud to be a Super User!
Paul on Linkedin.
- Mark as New
- Bookmark
- Subscribe
- Mute
- Subscribe to RSS Feed
- Permalink
- Report Inappropriate Content
Have you tried something like this:
color =
SWITCH( TRUE(),
max(MODEL_RESREK[Item_lay-out]) ="NETTO-RESULTAAT", "Yellow",
[BEDRAGEN] > 0, "Green",
[BEDRAGEN] < 0, "Red",
"White"
)
Respectfully,
Zoe Douglas (DataZoe)
Follow me on LinkedIn at https://www.linkedin.com/in/zoedouglas-data
See my reports and blog at https://www.datazoepowerbi.com/
- Mark as New
- Bookmark
- Subscribe
- Mute
- Subscribe to RSS Feed
- Permalink
- Report Inappropriate Content
Hi, this somehow turned all the other rows green and the row NETTO-RESULTAAT is still yellow. 🙂
- Mark as New
- Bookmark
- Subscribe
- Mute
- Subscribe to RSS Feed
- Permalink
- Report Inappropriate Content
@JoyceW Can you provide more details?
Here I have it set up like this:
And [PL Amount] is like this:
Respectfully,
Zoe Douglas (DataZoe)
Follow me on LinkedIn at https://www.linkedin.com/in/zoedouglas-data
See my reports and blog at https://www.datazoepowerbi.com/
- Mark as New
- Bookmark
- Subscribe
- Mute
- Subscribe to RSS Feed
- Permalink
- Report Inappropriate Content
Thanks for the detailed answer. It's hard for me to explain sometimes, since I'm still a beginner. Paul's solution worked!
Helpful resources

Power BI Dataviz World Championships
The Power BI Data Visualization World Championships is back! Get ahead of the game and start preparing now!

| User | Count |
|---|---|
| 39 | |
| 38 | |
| 38 | |
| 28 | |
| 27 |
| User | Count |
|---|---|
| 124 | |
| 88 | |
| 73 | |
| 66 | |
| 65 |


