Get certified for free when you join Fabric Data Days 2026 and dive into Fabric, Power BI, SQL, AI, and other essential data skills.
Join nowJuly 7 - July 17 | Round 2 of the Power BI Dataviz World Championships. Don't miss your chance! Learn more
It seems to me that conditional formatting does not work as expected on calculated columns.
How do you work around that?
Solved! Go to Solution.
Hi, @appsac1
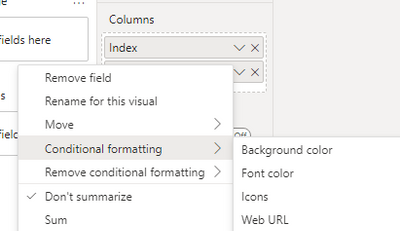
You can try the following methods.
Sample data:
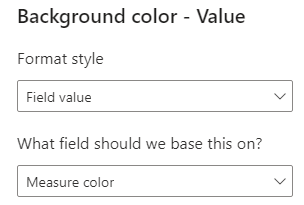
Measure color = IF(SUM('Table'[Value])<=50,"Green","Red")
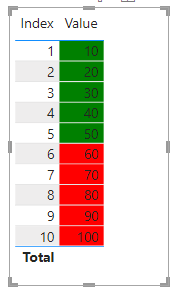
Result:
This adds conditional formatting to the calculation column. If it doesn't solve your problem, please provide sample data and desired output.
Best Regards,
Community Support Team _Charlotte
If this post helps, then please consider Accept it as the solution to help the other members find it more quickly.
Hi, @appsac1
You can try the following methods.
Sample data:
Measure color = IF(SUM('Table'[Value])<=50,"Green","Red")
Result:
This adds conditional formatting to the calculation column. If it doesn't solve your problem, please provide sample data and desired output.
Best Regards,
Community Support Team _Charlotte
If this post helps, then please consider Accept it as the solution to help the other members find it more quickly.
@appsac1 , Need example what is not working.
Conditional formatting works best when a measure drives it (Gradient/rule or field)
Learn Power BI Advance - PowerBI Abstract Thesis:
How to do conditional formatting by measure and apply it on pie?
https://www.youtube.com/watch?v=RqBb5eBf_I4&list=PLPaNVDMhUXGYo50Ajmr4SgSV9HIQLxc8L
https://community.powerbi.com/t5/Community-Blog/Power-BI-Conditional-formatting-the-Pie-Visual/ba-p/...
https://amitchandak.medium.com/power-bi-where-is-the-conditional-formatting-option-in-new-format-pan...
The information you have provided is not making the problem clear to me. Can you please explain with an example.
Appreciate your Kudos.
Join us in Barcelona for FabCon and SQLCon, the Fabric, Power BI, SQL, and AI community event. Save €200 with code FABCMTY200.
Join Data Days 2026: 60 days of free live/on-demand sessions, challenges, study groups, and certification opportunities.
| User | Count |
|---|---|
| 30 | |
| 28 | |
| 26 | |
| 23 | |
| 17 |
| User | Count |
|---|---|
| 57 | |
| 41 | |
| 31 | |
| 24 | |
| 20 |