FabCon is coming to Atlanta
Join us at FabCon Atlanta from March 16 - 20, 2026, for the ultimate Fabric, Power BI, AI and SQL community-led event. Save $200 with code FABCOMM.
Register now!- Power BI forums
- Get Help with Power BI
- Desktop
- Service
- Report Server
- Power Query
- Mobile Apps
- Developer
- DAX Commands and Tips
- Custom Visuals Development Discussion
- Health and Life Sciences
- Power BI Spanish forums
- Translated Spanish Desktop
- Training and Consulting
- Instructor Led Training
- Dashboard in a Day for Women, by Women
- Galleries
- Data Stories Gallery
- Themes Gallery
- Contests Gallery
- QuickViz Gallery
- Quick Measures Gallery
- Visual Calculations Gallery
- Notebook Gallery
- Translytical Task Flow Gallery
- TMDL Gallery
- R Script Showcase
- Webinars and Video Gallery
- Ideas
- Custom Visuals Ideas (read-only)
- Issues
- Issues
- Events
- Upcoming Events
The Power BI Data Visualization World Championships is back! Get ahead of the game and start preparing now! Learn more
- Power BI forums
- Forums
- Get Help with Power BI
- Desktop
- Re: Conditional custom column with some math
- Subscribe to RSS Feed
- Mark Topic as New
- Mark Topic as Read
- Float this Topic for Current User
- Bookmark
- Subscribe
- Printer Friendly Page
- Mark as New
- Bookmark
- Subscribe
- Mute
- Subscribe to RSS Feed
- Permalink
- Report Inappropriate Content
Conditional custom column with some math
Hi community,
Hope you can help me on this one.
I want to create a custom column in query editor based on some conditions which include summation and split of amounts. I was able to do this with excel, but can't find a way in powerBI so far...
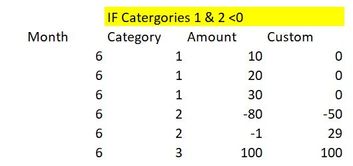
Let me explain: if the sum of amounts for categories 1 and 2 are negative (if they share same month), then category 1 should be zero and the sum of it's amounts must be splited and added into the raws of category 2. Other categories (like 3) untouched.
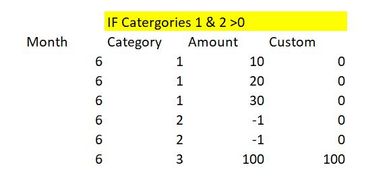
But, if the sum of categories 1 and 2 are positive (if they share month), then categories 1 and 2 must show zero and other categories untouched.
Also, number of raws here is very simple, but my data can have hundreds of raws, so the split must be dynamic depending on the number of raws for category 2 and only for the corresponding month.
Any ideas? you think this can be possible?
Solved! Go to Solution.
- Mark as New
- Bookmark
- Subscribe
- Mute
- Subscribe to RSS Feed
- Permalink
- Report Inappropriate Content
Hi @cpdanielmc21 ,
Thanks for explaining, I made this, hope that's what you want:
Measure 14 =
VAR sumcategory = CALCULATE(SUM('Table (4)'[Amount]),FILTER(ALL('Table (4)'[Category],'Table (4)'[Amount]),'Table (4)'[Category] in {1,2}))
VAR sumcategory1 = CALCULATE(SUM('Table (4)'[Amount]),FILTER(ALL('Table (4)'[Category],'Table (4)'[Amount]),'Table (4)'[Category] in {1}))
VAR countrow2 = CALCULATE(COUNTROWS('Table (4)'),FILTER(ALL('Table (4)'[Category],'Table (4)'[Amount]),'Table (4)'[Category] = 2))
RETURN IF(MAX('Table (4)'[Category]) = 3,SUM('Table (4)'[Amount]),
        IF(sumcategory < 0,
            IF(MAX('Table (4)'[Category]) = 1,0,sumcategory1 / countrow2 + SUM('Table (4)'[Amount])),
            0))
Aiolos Zhao
- Mark as New
- Bookmark
- Subscribe
- Mute
- Subscribe to RSS Feed
- Permalink
- Report Inappropriate Content
Hi @cpdanielmc21 ,
You can modify @Anonymous 's code and create a calculated column directly.
Column =
VAR sumcategory =
CALCULATE(
    SUM('Table (4)'[Amount]),
    FILTER(
       ALL( 'Table (4)'),
        'Table (4)'[Category] in {1,2} && 'Table (4)'[Month] = EARLIER('Table (4)'[Month] )
    )
)
VAR sumcategory1 =
CALCULATE(
    SUM('Table (4)'[Amount]),
    FILTER(
        ALL('Table (4)'),
        'Table (4)'[Category] = 1 && 'Table (4)'[Month] = EARLIER('Table (4)'[Month] )
    )
)
VAR countrow2 =
CALCULATE(
    COUNTROWS('Table (4)'),
    FILTER(
        ALL('Table (4)'),
        'Table (4)'[Category] = 2 && 'Table (4)'[Month] = EARLIER('Table (4)'[Month] )
    )
)
RETURN
IF(
    [Category] = 3,
    'Table (4)'[Amount],
    IF(
        sumcategory > 0,
        0,
        SWITCH(
            [Category],
            1, 0,
            2, (sumcategory1/countrow2) + 'Table (4)'[Amount]
        )
    )
)
Best regards,
Lionel Chen
If this post helps, then please consider Accept it as the solution to help the other members find it more quickly.
- Mark as New
- Bookmark
- Subscribe
- Mute
- Subscribe to RSS Feed
- Permalink
- Report Inappropriate Content
Hi @v-lionel-msft and @Anonymous
Both solutions work in different scenarios so I am using both, thank you!
- Mark as New
- Bookmark
- Subscribe
- Mute
- Subscribe to RSS Feed
- Permalink
- Report Inappropriate Content
@cpdanielmc21 , try new columns like
custom 1 = if([category] in{ 1,2} && [Amount] <0)
custom 2 = if([category] in{ 1,2} && [Amount] >0)
- Mark as New
- Bookmark
- Subscribe
- Mute
- Subscribe to RSS Feed
- Permalink
- Report Inappropriate Content
Hi @cpdanielmc21 ,
I think using DAX doing the logic is not hard, but i don't get the logic for split amount.
In scenario one, the total amount = -21. Then you want to split it to 2 rows(amount -80 and amount -1)
Why the custom number is -50 and 29?
Could you please help to explain how you get -50 and 29?
Thanks.
Aiolos Zhao
- Mark as New
- Bookmark
- Subscribe
- Mute
- Subscribe to RSS Feed
- Permalink
- Report Inappropriate Content
@Anonymous
Hi, sure
total for category 1 is 60, so this 60 must be assigned to category 2.
Since category 2 has 2 rows, the split is going to be 30 and 30.
-80 plus 30 = -50
-1 plus 30 = 29
so before this process, total for cat 1 and 2 was -21, and after the process is still -21, is just re-arranged.
- Mark as New
- Bookmark
- Subscribe
- Mute
- Subscribe to RSS Feed
- Permalink
- Report Inappropriate Content
Hi @cpdanielmc21 ,
Thanks for explaining, I made this, hope that's what you want:
Measure 14 =
VAR sumcategory = CALCULATE(SUM('Table (4)'[Amount]),FILTER(ALL('Table (4)'[Category],'Table (4)'[Amount]),'Table (4)'[Category] in {1,2}))
VAR sumcategory1 = CALCULATE(SUM('Table (4)'[Amount]),FILTER(ALL('Table (4)'[Category],'Table (4)'[Amount]),'Table (4)'[Category] in {1}))
VAR countrow2 = CALCULATE(COUNTROWS('Table (4)'),FILTER(ALL('Table (4)'[Category],'Table (4)'[Amount]),'Table (4)'[Category] = 2))
RETURN IF(MAX('Table (4)'[Category]) = 3,SUM('Table (4)'[Amount]),
        IF(sumcategory < 0,
            IF(MAX('Table (4)'[Category]) = 1,0,sumcategory1 / countrow2 + SUM('Table (4)'[Amount])),
            0))
Aiolos Zhao
- Mark as New
- Bookmark
- Subscribe
- Mute
- Subscribe to RSS Feed
- Permalink
- Report Inappropriate Content
@Anonymous Thanks!
One question, is there a way to do this directly as a custom column in the Data / step in query editor instead of measure?
Also, the measure works very well except when I start to filter:
So the thing is, later on I will create a summary with the total values per month of the categories, and this is what I get (Category 1 is zero, and 3 is 100 that's ok, but total category 2 should be -21)
- Mark as New
- Bookmark
- Subscribe
- Mute
- Subscribe to RSS Feed
- Permalink
- Report Inappropriate Content
I think it's another logic in your screenshot.
Do you want to show the amount column by sum or not sum?
In your screenshot, the amount is a sum, so every category will only have one amount.
But in your post, you split the category 1 amount to 3 rows, that's different. which one is you wanted?
Aiolos Zhao
Helpful resources

Power BI Dataviz World Championships
The Power BI Data Visualization World Championships is back! Get ahead of the game and start preparing now!

| User | Count |
|---|---|
| 54 | |
| 42 | |
| 34 | |
| 34 | |
| 21 |
| User | Count |
|---|---|
| 143 | |
| 125 | |
| 100 | |
| 81 | |
| 63 |


