FabCon is coming to Atlanta
Join us at FabCon Atlanta from March 16 - 20, 2026, for the ultimate Fabric, Power BI, AI and SQL community-led event. Save $200 with code FABCOMM.
Register now!- Power BI forums
- Get Help with Power BI
- Desktop
- Service
- Report Server
- Power Query
- Mobile Apps
- Developer
- DAX Commands and Tips
- Custom Visuals Development Discussion
- Health and Life Sciences
- Power BI Spanish forums
- Translated Spanish Desktop
- Training and Consulting
- Instructor Led Training
- Dashboard in a Day for Women, by Women
- Galleries
- Data Stories Gallery
- Themes Gallery
- Contests Gallery
- QuickViz Gallery
- Quick Measures Gallery
- Visual Calculations Gallery
- Notebook Gallery
- Translytical Task Flow Gallery
- TMDL Gallery
- R Script Showcase
- Webinars and Video Gallery
- Ideas
- Custom Visuals Ideas (read-only)
- Issues
- Issues
- Events
- Upcoming Events
The Power BI Data Visualization World Championships is back! It's time to submit your entry. Live now!
- Power BI forums
- Forums
- Get Help with Power BI
- Desktop
- Conditional Formatting
- Subscribe to RSS Feed
- Mark Topic as New
- Mark Topic as Read
- Float this Topic for Current User
- Bookmark
- Subscribe
- Printer Friendly Page
- Mark as New
- Bookmark
- Subscribe
- Mute
- Subscribe to RSS Feed
- Permalink
- Report Inappropriate Content
Conditional Formatting
Hi Everyone,
Having some issues with Conditional formatting in PBI. I have 3 scatter charts, all of them having the same information, however they are being filtered through a measure.
- Deviation (i.e Difference) for all data
- Deviation (i.e Difference) for only last 3 months
- Deviation (i.e Difference) for only last 12 months
For some reasons (even though same thing done for the others), the colour it only works for difference for last 3 months.
I'll try below to explain my steps:
Approval (column from raw data) - this is Whole number format ==> I've made a measure for SUM of Approval
Invoice (column from raw data) - this is Whole number format ==> I've made a measure for SUM of Invoice
==> I've made a measure to calculate difference between Approval and Invoice
The above (Deviation) is for all raw data. Next I've made 2 more measures, for last 3 months and last 12 months
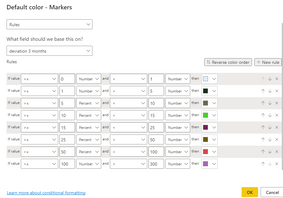
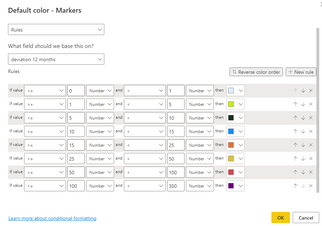
As you can see below, I've added some conditional formatting, for example Deviation numbers between 50 and 100 to be coloured red. This works for "Deviation last 3 months", but not for the rest
This is correct:
This it's not correct. Between 50 and 100 should be red but it's purple. Between 0 and 50 should not be red, but it's red and so on
As you can see below the colours between numbers. All the measures are in Whole number format so I don't know what exactly is wrong and why it works for last 3 months, but it doesn't for the other two, even though same steps made.
Do you have any idea why it's not working for the other two?
Solved! Go to Solution.
- Mark as New
- Bookmark
- Subscribe
- Mute
- Subscribe to RSS Feed
- Permalink
- Report Inappropriate Content
Hi,
Since my reply to you, I've deleted the two visuals (the ones that were copy paste) and added the same visual again, however this time withouth copy pasting it.
I haven't changed anything and now it works.
How and why it didn't work when I've copy paste it, I don't know but I have not the same exact visual, same setting as before and it's working.
- Mark as New
- Bookmark
- Subscribe
- Mute
- Subscribe to RSS Feed
- Permalink
- Report Inappropriate Content
Hi @Anonymous ,
Please check whether you have set "conditional formatting" on both two visuals.
I made a sample, and here are my steps.
Final output:
I attach my sample below for your reference.
Best Regards,
Community Support Team _ xiaosun
If this post helps, then please consider Accept it as the solution to help the other members find it more quickly.
- Mark as New
- Bookmark
- Subscribe
- Mute
- Subscribe to RSS Feed
- Permalink
- Report Inappropriate Content
Hi,
Both visuals have the conditional formatting. I've copy paste the visual twice and then removed the "Y axis" from Deviation 3 Months (measure created for that) - to Deviation for 12 months (other measure created).
So all visuals have the same setting, same coulours etc as they were copy paste.
The same applies with the measure - that's copy paste as well and I've only changed the numbers to have last 3 months, last 12 months.
I've checked your PBI and I have the same columsn format - "Whole number".
The measures I've put them as your format - "General"
Still not working for all months and last 12 months.
- Mark as New
- Bookmark
- Subscribe
- Mute
- Subscribe to RSS Feed
- Permalink
- Report Inappropriate Content
Hi @Anonymous ,
If convenient, could you please share your sample data (exclude sensitive data) or PBIX file to me in order that I can do some check?
You can reference the following document to attach files.
How to provide sample data in the Power BI Forum - Microsoft Power BI Community
Best Regards,
Community Support Team _ xiaosun
If this post helps, then please consider Accept it as the solution to help the other members find it more quickly.
- Mark as New
- Bookmark
- Subscribe
- Mute
- Subscribe to RSS Feed
- Permalink
- Report Inappropriate Content
Hi,
Since my reply to you, I've deleted the two visuals (the ones that were copy paste) and added the same visual again, however this time withouth copy pasting it.
I haven't changed anything and now it works.
How and why it didn't work when I've copy paste it, I don't know but I have not the same exact visual, same setting as before and it's working.
Helpful resources

Power BI Dataviz World Championships
The Power BI Data Visualization World Championships is back! It's time to submit your entry.

Power BI Monthly Update - January 2026
Check out the January 2026 Power BI update to learn about new features.

| User | Count |
|---|---|
| 60 | |
| 49 | |
| 30 | |
| 25 | |
| 23 |
| User | Count |
|---|---|
| 131 | |
| 103 | |
| 58 | |
| 39 | |
| 31 |


