cancel
Showing results for 
Search instead for 
Did you mean: 

July 7 - July 17 | Round 2 of the Power BI Dataviz World Championships. Don't miss your chance! Learn more

Reply
Eddlugonz
New Member

Conditional Formatting - Two Variables or more

Greetings to all, I hope you will be all right!

I would currently like to know if it is possible to conditionally format two or more values in a single array.

My example case is as follows: I have a product in different stores and I know which ones it has been sold in(1), it is sold out(2) and it is not sold(3).

Understanding that the product can be sold and sold out in a set time, when establishing the matrix by store and product, can I reflect the two possibilities of the product of the same store under a conditional format?

I hope the example is clear and you can support me.

Greetings and thanks!

1 ACCEPTED SOLUTION
Anonymous
Not applicable

HI @Eddlugonz 

Hope you mean in a sinle array is a single column.

Create a measure as

sold_stat = SWITCH(true(),

                   [col1] = "Sold",1,

                   [col1] = "Sold out",1,

                   [col1] = "Not Sold",1,0)

You change chage your conditions as per your requirement. this is what I could make out of it.

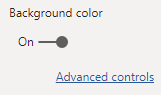
Then in the table or matrix go to formatting and Conditional formatting.

pranit828_0-1600469070469.png

pranit828_1-1600469107416.png

Select sold_stat and apply the format.

pranit828_2-1600469162962.png


View solution in original post

2 REPLIES 2
amitchandak
Super User
Super User

@Eddlugonz , Usually for the complex case I prefer the "Field value" Option in conditional formatting and use a measure with that.

With the current description, I am not able to suggest a measure. But refer to these examples.


Color Year = if(FIRSTNONBLANK('Table'[Year],2014) <=2016,"lightgreen",if(FIRSTNONBLANK('Table'[Year],2014)>2018,"red","yellow"))

Color  = if(FIRSTNONBLANK('Table'[Year],2014) <=2016 && AVERAGE(Sales[Sales Amount])<170 
,"lightgreen",if(FIRSTNONBLANK('Table'[Year],2014)>2018,"red","yellow"))
Color sales = if([Sales Today] -[sales yesterday]>0,"green","red")


You can use meausres and dimesnions values with max/min/firstnonblank/lastnonblank etc.


Refer how to use here

https://radacad.com/dax-and-conditional-formatting-better-together-find-the-biggest-and-smallest-num...
https://docs.microsoft.com/en-us/power-bi/desktop-conditional-table-formatting#color-by-color-values


In case you think this what can help you, see how the row context play a role in conditional formatting: https://youtu.be/Q1vPWmfI25o?t=2770

Share with Power BI Enthusiasts: Full Power BI Video (20 Hours) YouTube
Microsoft Fabric Series 60+ Videos YouTube
Microsoft Fabric Hindi End to End YouTube
Anonymous
Not applicable

HI @Eddlugonz 

Hope you mean in a sinle array is a single column.

Create a measure as

sold_stat = SWITCH(true(),

                   [col1] = "Sold",1,

                   [col1] = "Sold out",1,

                   [col1] = "Not Sold",1,0)

You change chage your conditions as per your requirement. this is what I could make out of it.

Then in the table or matrix go to formatting and Conditional formatting.

pranit828_0-1600469070469.png

pranit828_1-1600469107416.png

Select sold_stat and apply the format.

pranit828_2-1600469162962.png


Helpful resources

Announcements
FabCon and SQLCon Barcelona 2026

FabCon & SQLCon – Barcelona 2026

Join us in Barcelona for FabCon and SQLCon, the Fabric, Power BI, SQL, and AI community event. Save €200 with code FABCMTY200.

60 days of Data Days Carousel

Data Days 2026

Join Data Days 2026: 60 days of free live/on-demand sessions, challenges, study groups, and certification opportunities.

Power BI DataViz World Championships carousel

Power BI DataViz World Championships - June 2026

A new Power BI DataViz World Championship is coming this June! Don't miss out on submitting your entry.

Top Solution Authors