FabCon is coming to Atlanta
Join us at FabCon Atlanta from March 16 - 20, 2026, for the ultimate Fabric, Power BI, AI and SQL community-led event. Save $200 with code FABCOMM.
Register now!- Power BI forums
- Get Help with Power BI
- Desktop
- Service
- Report Server
- Power Query
- Mobile Apps
- Developer
- DAX Commands and Tips
- Custom Visuals Development Discussion
- Health and Life Sciences
- Power BI Spanish forums
- Translated Spanish Desktop
- Training and Consulting
- Instructor Led Training
- Dashboard in a Day for Women, by Women
- Galleries
- Data Stories Gallery
- Themes Gallery
- Contests Gallery
- Quick Measures Gallery
- Notebook Gallery
- Translytical Task Flow Gallery
- TMDL Gallery
- R Script Showcase
- Webinars and Video Gallery
- Ideas
- Custom Visuals Ideas (read-only)
- Issues
- Issues
- Events
- Upcoming Events
To celebrate FabCon Vienna, we are offering 50% off select exams. Ends October 3rd. Request your discount now.
- Power BI forums
- Forums
- Get Help with Power BI
- Desktop
- Re: Comparing dates from 2 tables to select a valu...
- Subscribe to RSS Feed
- Mark Topic as New
- Mark Topic as Read
- Float this Topic for Current User
- Bookmark
- Subscribe
- Printer Friendly Page
- Mark as New
- Bookmark
- Subscribe
- Mute
- Subscribe to RSS Feed
- Permalink
- Report Inappropriate Content
Comparing dates from 2 tables to select a value for the exchange rate
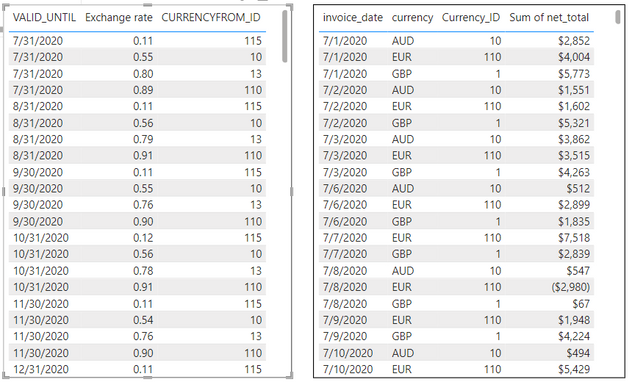
Hi Power BI Community - can anyone help me with the measure that I need to write to accomplish this? I am really striking out on this and need help. I have 2 tables; Table A - exchange rate table with rates posted at the end of each month, and table B - invoice table with dates, amounts in local currency and currency type. I need a measure that will compare the invoice_date and currency_ID to the exchange rate table and bring back the correct rate. The exchange rates are posted at the end of the month so that the 7/31/2020 exchange rate is applied to invoices during the month of July.
Solved! Go to Solution.
- Mark as New
- Bookmark
- Subscribe
- Mute
- Subscribe to RSS Feed
- Permalink
- Report Inappropriate Content
Assuming VALID_UNTIL and CURRENCYFROM_ID are a composite key for Table A, you could add a calculated column to both tables and relate them that way to then pull over corresponding exchange rate. Calculated column DAX would look like:
'Table A'[ExId] =
VAR _dt = 'Table A'[VALID_UNTIL]
VAR _exId = 'Table A'[CURRENCYFROM_ID]
RETURN
_exId  * 10^8
+ YEAR( _dt  ) * 10^4
+ MONTH( _dt ) * 10^2
+ DAY( _dt )

'Table B'[ExId] =
VAR _dt = EOMONTH( 'Table B'[invoice_date], 0 )
VAR _exId = 'Table B'[Currency_ID]
RETURN
_exId  * 10^8
+ YEAR( _dt  ) * 10^4
+ MONTH( _dt ) * 10^2
+ DAY( _dt )
- Mark as New
- Bookmark
- Subscribe
- Mute
- Subscribe to RSS Feed
- Permalink
- Report Inappropriate Content
Thank you - this was very helpful!
- Mark as New
- Bookmark
- Subscribe
- Mute
- Subscribe to RSS Feed
- Permalink
- Report Inappropriate Content
Thanks - I will try it.
Helpful resources
| User | Count |
|---|---|
| 98 | |
| 76 | |
| 74 | |
| 49 | |
| 26 |


