Get Fabric or SQL Certified for Free.
Get certified for free when you join Fabric Data Days 2026 and dive into Fabric, Power BI, SQL, AI, and other essential data skills.
Join now- Power BI forums
- Get Help with Power BI
- Desktop
- Service
- Report Server
- Power Query
- Mobile Apps
- Developer
- DAX Commands and Tips
- Custom Visuals Development Discussion
- Health and Life Sciences
- Power BI Spanish forums
- Translated Spanish Desktop
- Training and Consulting
- Instructor Led Training
- Dashboard in a Day for Women, by Women
- Galleries
- Data Stories Gallery
- Themes Gallery
- Contests Gallery
- QuickViz Gallery
- Quick Measures Gallery
- Visual Calculations Gallery
- Fabric Apps Gallery
- Notebook Gallery
- Translytical Task Flow Gallery
- TMDL Gallery
- R Script Showcase
- Webinars and Video Gallery
- Ideas
- Custom Visuals Ideas (read-only)
- Issues
- Issues
- Events
- Upcoming Events
July 28 - August 9 | Final Round of the Power BI Dataviz World Championships. This is your chance. Learn more
- Power BI forums
- Forums
- Get Help with Power BI
- Desktop
- Re: Column filter
- Subscribe to RSS Feed
- Mark Topic as New
- Mark Topic as Read
- Float this Topic for Current User
- Bookmark
- Subscribe
- Printer Friendly Page

- Mark as New
- Bookmark
- Subscribe
- Mute
- Subscribe to RSS Feed
- Permalink
- Report Inappropriate Content
Column filter
hi,
a basic quick question,
if I have a column A , and column A returns either 'b' and 'c', but I want to show them both on a pie chart,
how do I go about it?
I have applied
bA = (tablename[A] ), 'b'
cA = (tablename[A] ), 'c'
where am I wrong?
Solved! Go to Solution.


- Mark as New
- Bookmark
- Subscribe
- Mute
- Subscribe to RSS Feed
- Permalink
- Report Inappropriate Content
Did I answer your question? Mark my post as a solution!
Proud to be a PBI Community Champion
- Mark as New
- Bookmark
- Subscribe
- Mute
- Subscribe to RSS Feed
- Permalink
- Report Inappropriate Content
Thanks,
for some reasons I still get syntax error on the logic but I belive this is what I need,


- Mark as New
- Bookmark
- Subscribe
- Mute
- Subscribe to RSS Feed
- Permalink
- Report Inappropriate Content
Hi atrinhatra,
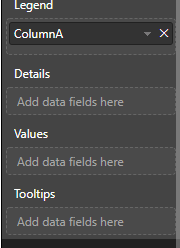
A pie chart at least needs two columns, value column and legend column, if columnA is a category column, put columnA to legend field and another column to value field.
Regards,
Jimmy Tao
- Mark as New
- Bookmark
- Subscribe
- Mute
- Subscribe to RSS Feed
- Permalink
- Report Inappropriate Content
You may have missundrestood my question.
columnA returns 'yes' or 'no'
but I want to show if columnA = 'yes' show 'pass'
if columnA = 'no' show 'failed'
another word , I am asking the DAX syntax of above
- Mark as New
- Bookmark
- Subscribe
- Mute
- Subscribe to RSS Feed
- Permalink
- Report Inappropriate Content
@Anonymous Is this what you are looking for ? Try this as a new column
Flag = SWITCH(TRUE(),Table[ColumnA]="Yes","Pass",Table[ColumnA]="No","Failed")
Did I answer your question? Mark my post as a solution!
Proud to be a PBI Community Champion
- Mark as New
- Bookmark
- Subscribe
- Mute
- Subscribe to RSS Feed
- Permalink
- Report Inappropriate Content
Thanks, Yes thats what I am after, however what does FLag represents? the code gives an error " THE syntax for 'FLag' in incorrect, (DAX(..........
- Mark as New
- Bookmark
- Subscribe
- Mute
- Subscribe to RSS Feed
- Permalink
- Report Inappropriate Content
Did I answer your question? Mark my post as a solution!
Proud to be a PBI Community Champion
- Mark as New
- Bookmark
- Subscribe
- Mute
- Subscribe to RSS Feed
- Permalink
- Report Inappropriate Content
Thanks,
for some reasons I still get syntax error on the logic but I belive this is what I need,
Helpful resources

FabCon & SQLCon – Barcelona 2026
Join us in Barcelona for FabCon and SQLCon, the Fabric, Power BI, SQL, and AI community event. Save €200 with code FABCMTY200.

Fabric Community Sticker Challenge - Barcelona 2026
If you love stickers, then you will definitely want to check out our community sticker challenge, Barcelona edition!

Power BI Monthly Update - July 2026
Check out the July 2026 Power BI update to learn about new features.

Power BI DataViz World Championships - June 2026
A new Power BI DataViz World Championship is coming this June! Don't miss out on submitting your entry.

| User | Count |
|---|---|
| 30 | |
| 28 | |
| 25 | |
| 24 | |
| 16 |


| User | Count |
|---|---|
| 48 | |
| 32 | |
| 17 | |
| 16 | |
| 16 |


