Become a Certified Power BI Data Analyst!
Join us for an expert-led overview of the tools and concepts you'll need to pass exam PL-300. The first session starts on June 11th. See you there!
Get registered- Power BI forums
- Get Help with Power BI
- Desktop
- Service
- Report Server
- Power Query
- Mobile Apps
- Developer
- DAX Commands and Tips
- Custom Visuals Development Discussion
- Health and Life Sciences
- Power BI Spanish forums
- Translated Spanish Desktop
- Training and Consulting
- Instructor Led Training
- Dashboard in a Day for Women, by Women
- Galleries
- Webinars and Video Gallery
- Data Stories Gallery
- Themes Gallery
- Contests Gallery
- Quick Measures Gallery
- Notebook Gallery
- Translytical Task Flow Gallery
- R Script Showcase
- Ideas
- Custom Visuals Ideas (read-only)
- Issues
- Issues
- Events
- Upcoming Events
Power BI is turning 10! Let’s celebrate together with dataviz contests, interactive sessions, and giveaways. Register now.
- Power BI forums
- Forums
- Get Help with Power BI
- Desktop
- Re: Chart Titles that adjust to the drill down lay...
- Subscribe to RSS Feed
- Mark Topic as New
- Mark Topic as Read
- Float this Topic for Current User
- Bookmark
- Subscribe
- Printer Friendly Page
- Mark as New
- Bookmark
- Subscribe
- Mute
- Subscribe to RSS Feed
- Permalink
- Report Inappropriate Content
Chart Titles that adjust to the drill down layer
Hi All,
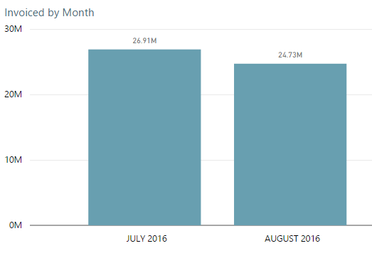
I have a chart that displays Invoicing by Month.
At the upper most level, the title is fine. Invoicing by Month. The report is designed to be for Financial YTD only, so will only ever show a max of 12 columns.
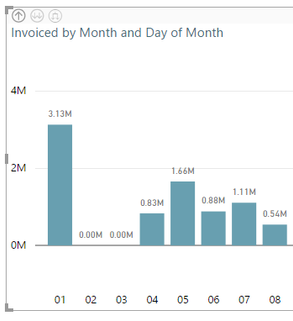
However the report has a drill down, for each month that breaks the invoicing out to day of month.
This shows the title "Invoicing by Month by Day of Month" which is not what im after.
If I have drilled down into July, I'd like the report title to show "Invoicing for July 2016 by day of month", so the person running the report has some context for what they are looking at.
Its rather difficult to explain the usefulness of a report to a sales exec of when they are trying to figure their month breakdown and cant even tell what month they are looking at for said breakdown.
Note, This report does have a 'Division' slicer on the right of the invoicing by month chart. We do not need this being incorporated into the title, however I mention in the event it needs to be factored into any formula design.
So theres two things here:
1) Layer 0 is fine, it may have a "generic" title
2) Layer 1 should be dynamic to show what data has been drilled into.
I am open to the idea of suppressing default titles and using formulas, however would need some guidance here.
Thanks,
Andrew
Solved! Go to Solution.
- Mark as New
- Bookmark
- Subscribe
- Mute
- Subscribe to RSS Feed
- Permalink
- Report Inappropriate Content
Hi @andrmh,
The blog which BhaveshPatel provided is use card visual and slicer to achieve the dynamic title.
Hide the default title, and get the select value from slicer, then deal with these data and convert them to specify format.
For example.
Measure:
SelectValue =
var selected= ALLSELECTED(Cycle[DayOfWeek])
var leftPart=CONCATENATEX(TOPN(COUNTROWS(selected)-1,selected),[DayOfWeek]&",")//use topn and countrow to remove last record
var rightPart=EXCEPT(selected,TOPN(COUNTROWS(selected)-1,selected))//use except function to get the last record
var resultString= LEFT(leftPart,LEN(leftPart)-1)&" And "&rightPart//merge left part and right part
Return
"Dynamic title by "&if( COUNTROWS(selected)=1,ALLSELECTED(Cycle[DayOfWeek]),resultString)//check select records' count, if selected records' count greater or equal than 2, use merged result string
Create a card visual and drag this measure to it, then turn off the category label.
Create a slicer to choose the display value.
Drag the card visual ot left top corner of the chart.
Click on slicer to change the result string.
Reference of Dax function:
Regards,
Xiaoxin Sheng
- Mark as New
- Bookmark
- Subscribe
- Mute
- Subscribe to RSS Feed
- Permalink
- Report Inappropriate Content
- Mark as New
- Bookmark
- Subscribe
- Mute
- Subscribe to RSS Feed
- Permalink
- Report Inappropriate Content
Hi Bhavesh,
Thanks for the link.
Do drill downs behave as 'filters' this way?
I had stumbled by this blog before and had not managed to get it working as the example seems to be referencing slicer data.
Not being too familiar with DAX, if i make a simple formula:
selectedMonths = COUNTROWS(VALUES (Invoicing_ALL[Month] ))
At the upper level, I get a value of 5 (5 rows - July through November), when I drill down clicking on say July, that number is still 5.
There must be a way I am able to identify the context of what I have selected to drill into... Might even be missine something very simple.
Thanks.
- Mark as New
- Bookmark
- Subscribe
- Mute
- Subscribe to RSS Feed
- Permalink
- Report Inappropriate Content
Hi @andrmh,
The blog which BhaveshPatel provided is use card visual and slicer to achieve the dynamic title.
Hide the default title, and get the select value from slicer, then deal with these data and convert them to specify format.
For example.
Measure:
SelectValue =
var selected= ALLSELECTED(Cycle[DayOfWeek])
var leftPart=CONCATENATEX(TOPN(COUNTROWS(selected)-1,selected),[DayOfWeek]&",")//use topn and countrow to remove last record
var rightPart=EXCEPT(selected,TOPN(COUNTROWS(selected)-1,selected))//use except function to get the last record
var resultString= LEFT(leftPart,LEN(leftPart)-1)&" And "&rightPart//merge left part and right part
Return
"Dynamic title by "&if( COUNTROWS(selected)=1,ALLSELECTED(Cycle[DayOfWeek]),resultString)//check select records' count, if selected records' count greater or equal than 2, use merged result string
Create a card visual and drag this measure to it, then turn off the category label.
Create a slicer to choose the display value.
Drag the card visual ot left top corner of the chart.
Click on slicer to change the result string.
Reference of Dax function:
Regards,
Xiaoxin Sheng
- Mark as New
- Bookmark
- Subscribe
- Mute
- Subscribe to RSS Feed
- Permalink
- Report Inappropriate Content
This is an excellent tutorial but I have an extended question!
I have the Card working to show the selected category when chosen without drill down turned on. However when drill down is ENABLED, and I click on a category it just keeps the default text.
Is there a way for this to carry over with the drill down turned on or is the slicer the only option?
Helpful resources
| User | Count |
|---|---|
| 84 | |
| 73 | |
| 67 | |
| 42 | |
| 35 |
| User | Count |
|---|---|
| 109 | |
| 56 | |
| 52 | |
| 45 | |
| 43 |


