Fabric Data Days starts November 4th!
Advance your Data & AI career with 50 days of live learning, dataviz contests, hands-on challenges, study groups & certifications and more!
Get registered- Power BI forums
- Get Help with Power BI
- Desktop
- Service
- Report Server
- Power Query
- Mobile Apps
- Developer
- DAX Commands and Tips
- Custom Visuals Development Discussion
- Health and Life Sciences
- Power BI Spanish forums
- Translated Spanish Desktop
- Training and Consulting
- Instructor Led Training
- Dashboard in a Day for Women, by Women
- Galleries
- Data Stories Gallery
- Themes Gallery
- Contests Gallery
- Quick Measures Gallery
- Visual Calculations Gallery
- Notebook Gallery
- Translytical Task Flow Gallery
- TMDL Gallery
- R Script Showcase
- Webinars and Video Gallery
- Ideas
- Custom Visuals Ideas (read-only)
- Issues
- Issues
- Events
- Upcoming Events
Get Fabric Certified for FREE during Fabric Data Days. Don't miss your chance! Learn more
- Power BI forums
- Forums
- Get Help with Power BI
- Desktop
- Re: Change matrix visual layout to show data on tw...
- Subscribe to RSS Feed
- Mark Topic as New
- Mark Topic as Read
- Float this Topic for Current User
- Bookmark
- Subscribe
- Printer Friendly Page
- Mark as New
- Bookmark
- Subscribe
- Mute
- Subscribe to RSS Feed
- Permalink
- Report Inappropriate Content
Change matrix visual layout to show data on two rows
Hi
I'm currently presenting performance data in a matrix with the below format:
To easier get an overview of the two value sets I would like to present the matrix in the below format
I've tried reading about the 'drill down' and 'Stepped layout' actions, which I suspect is the way to go. However I must admit I'm unable to figure it out. Can anyone please help??
Solved! Go to Solution.
- Mark as New
- Bookmark
- Subscribe
- Mute
- Subscribe to RSS Feed
- Permalink
- Report Inappropriate Content
Hi @KasperFB ,
Do you want base on row instead of column to show the columns in matrix-value-field? Here I suggest you to try "Switch values to row" function.
My Sample:
Best Regards,
Rico Zhou
If this post helps, then please consider Accept it as the solution to help the other members find it more quickly.
- Mark as New
- Bookmark
- Subscribe
- Mute
- Subscribe to RSS Feed
- Permalink
- Report Inappropriate Content
Hi Rico Zhou
This is exactly what I was trying to do.
The "Switch values to row" function did the trick.
Thank you very much for your assistance 🙂
- Mark as New
- Bookmark
- Subscribe
- Mute
- Subscribe to RSS Feed
- Permalink
- Report Inappropriate Content
hi @KasperFB ,
Its very simple, if you have the Availability and Corrected as values in one column. If , yes then you can directly drag and drop it in the Rows option below the Unit.
Regards,
Nikhil Chenna
Appreciate with a Kudos!! (Click the Thumbs Up Button)
Did I answer your question? Mark my post as a solution!
- Mark as New
- Bookmark
- Subscribe
- Mute
- Subscribe to RSS Feed
- Permalink
- Report Inappropriate Content
Nikhil Chenna
I'm not sure what you mean. I have the values as two seperate columns yes.
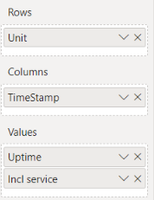
When I drag and drop them to the rows under the unit, it divides the rows into the values instead of "uptime" and "incl service".
Helpful resources

Fabric Data Days
Advance your Data & AI career with 50 days of live learning, contests, hands-on challenges, study groups & certifications and more!

Power BI Monthly Update - October 2025
Check out the October 2025 Power BI update to learn about new features.


