Fabric Data Days starts November 4th!
Advance your Data & AI career with 50 days of live learning, dataviz contests, hands-on challenges, study groups & certifications and more!
Get registered- Power BI forums
- Get Help with Power BI
- Desktop
- Service
- Report Server
- Power Query
- Mobile Apps
- Developer
- DAX Commands and Tips
- Custom Visuals Development Discussion
- Health and Life Sciences
- Power BI Spanish forums
- Translated Spanish Desktop
- Training and Consulting
- Instructor Led Training
- Dashboard in a Day for Women, by Women
- Galleries
- Data Stories Gallery
- Themes Gallery
- Contests Gallery
- Quick Measures Gallery
- Visual Calculations Gallery
- Notebook Gallery
- Translytical Task Flow Gallery
- TMDL Gallery
- R Script Showcase
- Webinars and Video Gallery
- Ideas
- Custom Visuals Ideas (read-only)
- Issues
- Issues
- Events
- Upcoming Events
Join us at FabCon Atlanta from March 16 - 20, 2026, for the ultimate Fabric, Power BI, AI and SQL community-led event. Save $200 with code FABCOMM. Register now.
- Power BI forums
- Forums
- Get Help with Power BI
- Desktop
- Re: Change image dynamically through slicer hierar...
- Subscribe to RSS Feed
- Mark Topic as New
- Mark Topic as Read
- Float this Topic for Current User
- Bookmark
- Subscribe
- Printer Friendly Page
- Mark as New
- Bookmark
- Subscribe
- Mute
- Subscribe to RSS Feed
- Permalink
- Report Inappropriate Content
Change image dynamically through slicer hierarchy
Hello there,
I have seen other posts talk about changing images dynamically with slicers but I haven't seen anyone mention this specific case yet.
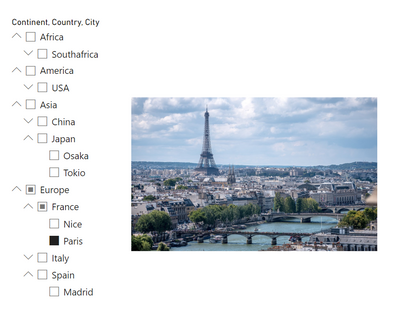
I have this sample table "Continent > Country > City" and I created a slicer with those three fields, so it was displayed like this:
So, the point is to show a different image depending on the case selected, BUT, also considering different steps of the hierarchy. For example, if Paris is selected, I would want to show an image of Paris (via url, by the way) like this:
But if France is selected, which would make Nice and Paris selected, I want to show a picture of France, like this:
So, is there any way I can make this happen?
Thank you for your time and patience.
Regards,
Solved! Go to Solution.
- Mark as New
- Bookmark
- Subscribe
- Mute
- Subscribe to RSS Feed
- Permalink
- Report Inappropriate Content
@Anonymous
That table is not enough. You will need the image URLs for cities and countries at least. You can adopt several structures. One of them in the attached file, where you can see it all at work.
You can create a measure that will yield the desired URL depending on the selection on the slicer. That can then be the input for the visual showing the images
_VisualInput =
IF (
    ISFILTERED ( Table1[City] ),
    SELECTEDVALUE ( Table1[City_Image] ),
    IF ( ISFILTERED ( Table1[Country] ), SELECTEDVALUE ( Table1[Country_Image] ) )
)
|
|
Please accept the solution when done and consider giving a thumbs up if posts are helpful. Contact me privately for support with any larger-scale BI needs, tutoring, etc. |
- Mark as New
- Bookmark
- Subscribe
- Mute
- Subscribe to RSS Feed
- Permalink
- Report Inappropriate Content
Hi @Anonymous
Can you share the pbix, by any chance? Or at least a sample of your data showing the structure of your tables and the kind of visual you are using (the one showing the pictures)
|
|
Please accept the solution when done and consider giving a thumbs up if posts are helpful. Contact me privately for support with any larger-scale BI needs, tutoring, etc. |
- Mark as New
- Bookmark
- Subscribe
- Mute
- Subscribe to RSS Feed
- Permalink
- Report Inappropriate Content
Hi @AlB
I sadly can't share the file, but I don't think it's necessary because it's a very simple table like:
| Continent | Country | City |
| Europe | Spain | Madrid |
| Europe | France | Paris |
| Europe | France | Nice |
| America | USA | New York |
And the image in the screenshot is a picture I downloaded for the example and paste it in the report, but in the real scenario it would be another table with a column of the sharepoint file url where the pictures are and a column of the City/Country/Continent (depending on what the picture is).
Apologies for not being able to upload the file, I tried to explain the situation as best as I could.
Thank you,
Helpful resources

Fabric Data Days
Advance your Data & AI career with 50 days of live learning, contests, hands-on challenges, study groups & certifications and more!

Power BI Monthly Update - October 2025
Check out the October 2025 Power BI update to learn about new features.

| User | Count |
|---|---|
| 75 | |
| 36 | |
| 31 | |
| 29 | |
| 26 |


