Hi experts!
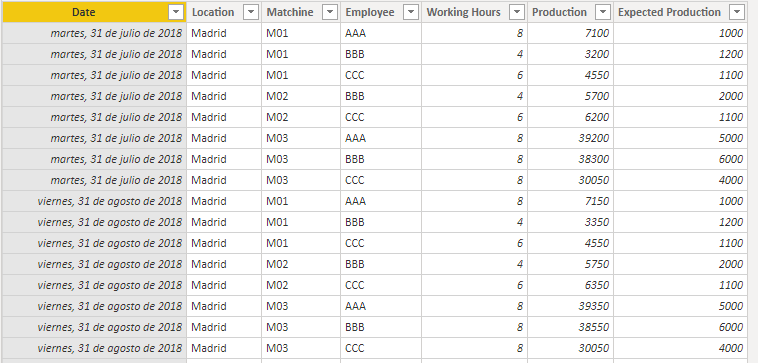
After doing lot of research in this forum and with the help of some of you, I have built a data table (see attached the pbix file);which shows the productivity in % for diferent machines and differente locations. But this brings me to a final step that Im not able to solve it by myself.
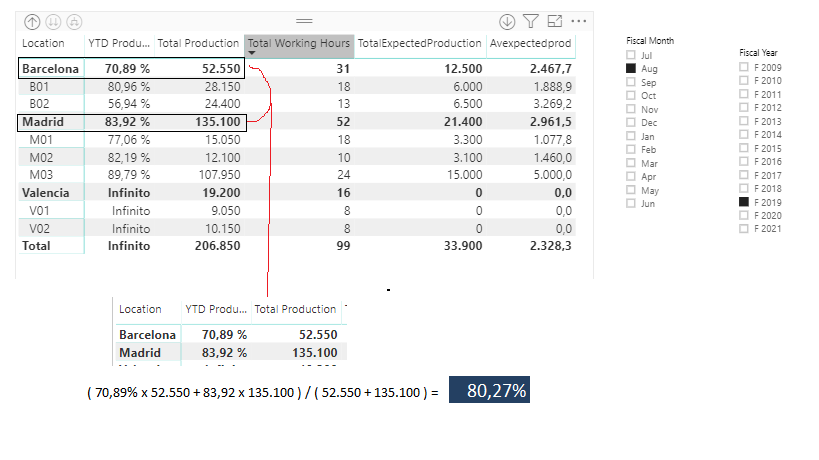
What I am trying to do is to take out from the table below, just the result from Madrid (70,89%) and Barcelona (83,92%) and consolidate both results weighting them according to "total production" measure.
( 70,89% x 52.550 + 83,92 x 135.100 ) / ( 52.550 + 135.100 ) = 80,27%
Here are my measures:
Total Production = sum(Database[Production])

Total Working Hours = sum(Database[Working Hours])

TotalExpectedProduction = sum(Database[Expected Production])

Avexpectedprod = divide(sumx(Database;[TotalExpectedProduction]*[Total Working Hours]);sum(Database[Working Hours]))

YTD Productivity =
CALCULATE (
    DIVIDE (
        SUMX (
            SUMMARIZE (
                Database;
                Database[Matchine];
                "AA"; [Total Production] / ( [Total Working Hours] * [Avexpectedprod] )
            );
            [AA] * [Total Working Hours]
        );
        [Total Working Hours];
        0
    );
    DATESYTD ( Calendar[Date]; "30/06" );
    FILTER (
        ALL ( 'Calendar' );
        'Calendar'[Date] <= MAX ( 'Calendar'[Date] )
            && 'Calendar'[Fiscal Year] = MAX ( 'Calendar'[Fiscal Year] )
    )
)
The tadabase format
The output in matrix table and the result that I need to achieve:
Thank you very much for your support
Reub


