Get certified for free when you join Fabric Data Days 2026 and dive into Fabric, Power BI, SQL, AI, and other essential data skills.
Join nowJuly 28 - August 9 | Final Round of the Power BI Dataviz World Championships. This is your chance. Learn more
Hello,
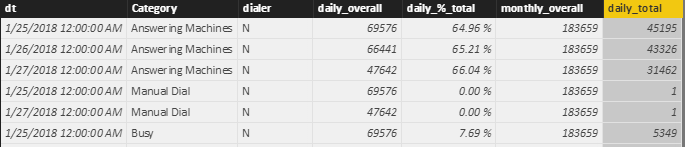
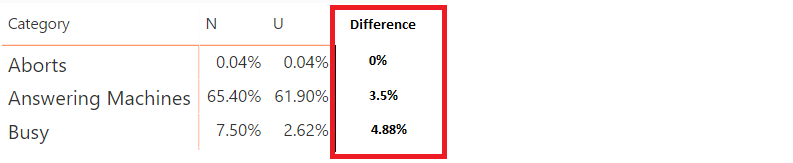
Pardon my ignorance, but I am in need of some direction/assiatnce. I have a table that I need to calculate the difference of the daily_%_total by column "dialer" (has 2 values, N and U) and column "dt".
Is this possible within Power BI? I have tried filtering, grouping as well as allexcept without any success.
Source table:
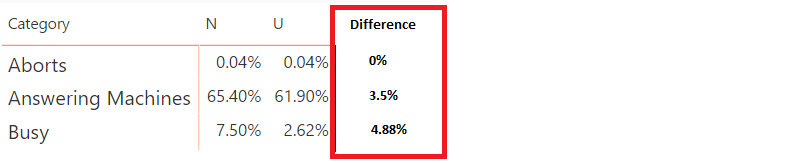
Desired Result:
Any assitance is greatly appreciated.
Solved! Go to Solution.
Hi @MRadaci,
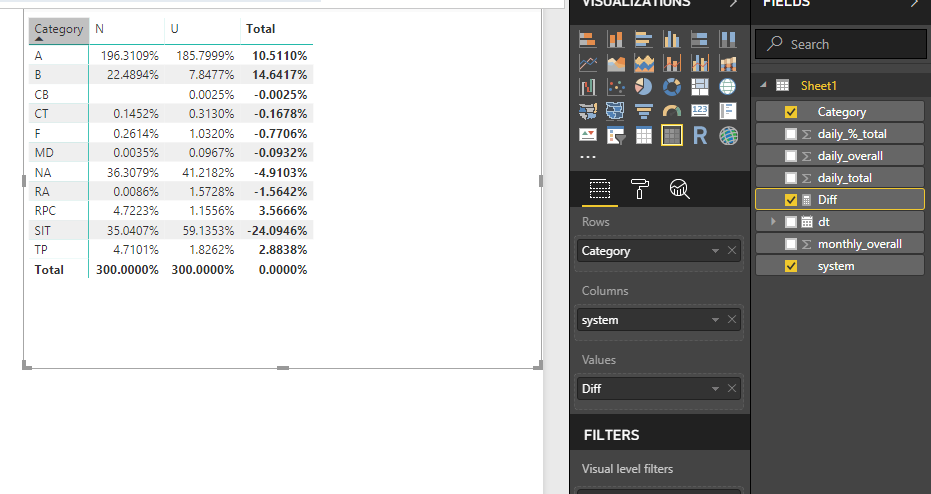
You can try to use below formula to show diff on total level.
Diff =
IF (
ISFILTERED ( Sheet1[system] ),
SUM ( Sheet1[daily_%_total] ),
CALCULATE ( SUM ( Sheet1[daily_%_total] ), Sheet1[system] = "N" )
- CALCULATE ( SUM ( Sheet1[daily_%_total] ), Sheet1[system] = "U" )
)
Regards,
Xiaoxin Sheng
HI @MRadaci,
It will be help if you share sample data/pbix file for test.
In addition, if you mean create dynamic column/table from slicer/filter, current power bi not support this, please use measure to instead.
Calculated Column/Table Change Dynamically According to Slicer Selection in the Report.
Regards,
Xiaoxin Sheng
Hi Xiaoxin!
Thanks for your response. I have attached a sample dataset (xls).
The goal is for a sliced date, compare difference in systems (N vs. U) for each category's %.
Thanks for any assitance you can provide.
https://github.com/AFC1886/SampleData/blob/master/Example%20Data.xlsx
Hi @MRadaci,
You can try to use below formula to show diff on total level.
Diff =
IF (
ISFILTERED ( Sheet1[system] ),
SUM ( Sheet1[daily_%_total] ),
CALCULATE ( SUM ( Sheet1[daily_%_total] ), Sheet1[system] = "N" )
- CALCULATE ( SUM ( Sheet1[daily_%_total] ), Sheet1[system] = "U" )
)
Regards,
Xiaoxin Sheng
Hi @Anonymous,
I just wanted to say thanks for your assitnace. It was very helpful. What a great community!
Join us in Barcelona for FabCon and SQLCon, the Fabric, Power BI, SQL, and AI community event. Save €200 with code FABCMTY200.
If you love stickers, then you will definitely want to check out our community sticker challenge, Barcelona edition!
Check out the July 2026 Power BI update to learn about new features.
| User | Count |
|---|---|
| 30 | |
| 28 | |
| 25 | |
| 24 | |
| 16 |
| User | Count |
|---|---|
| 48 | |
| 32 | |
| 17 | |
| 16 | |
| 16 |