- Power BI forums
- Updates
- News & Announcements
- Get Help with Power BI
- Desktop
- Service
- Report Server
- Power Query
- Mobile Apps
- Developer
- DAX Commands and Tips
- Custom Visuals Development Discussion
- Health and Life Sciences
- Power BI Spanish forums
- Translated Spanish Desktop
- Power Platform Integration - Better Together!
- Power Platform Integrations (Read-only)
- Power Platform and Dynamics 365 Integrations (Read-only)
- Training and Consulting
- Instructor Led Training
- Dashboard in a Day for Women, by Women
- Galleries
- Community Connections & How-To Videos
- COVID-19 Data Stories Gallery
- Themes Gallery
- Data Stories Gallery
- R Script Showcase
- Webinars and Video Gallery
- Quick Measures Gallery
- 2021 MSBizAppsSummit Gallery
- 2020 MSBizAppsSummit Gallery
- 2019 MSBizAppsSummit Gallery
- Events
- Ideas
- Custom Visuals Ideas
- Issues
- Issues
- Events
- Upcoming Events
- Community Blog
- Power BI Community Blog
- Custom Visuals Community Blog
- Community Support
- Community Accounts & Registration
- Using the Community
- Community Feedback
Register now to learn Fabric in free live sessions led by the best Microsoft experts. From Apr 16 to May 9, in English and Spanish.
- Power BI forums
- Forums
- Get Help with Power BI
- Desktop
- Calculated column based on the number entered in a...
- Subscribe to RSS Feed
- Mark Topic as New
- Mark Topic as Read
- Float this Topic for Current User
- Bookmark
- Subscribe
- Printer Friendly Page


- Mark as New
- Bookmark
- Subscribe
- Mute
- Subscribe to RSS Feed
- Permalink
- Report Inappropriate Content
Calculated column based on the number entered in a slicer
Hi Folks,
I need your ugent help on the current project
So, basically, I have given below table in PowerBI:
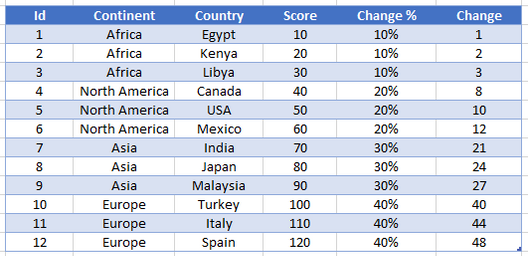
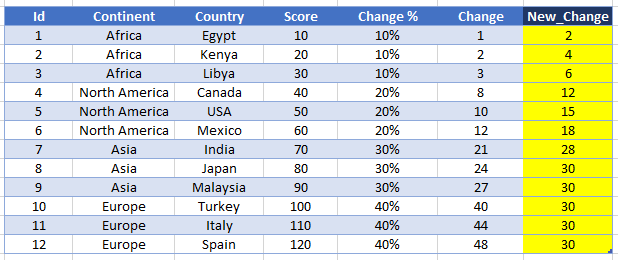
Now here I would like to create a calculated column "New_Change" where I enter a value for each "Continent" in a slicer & "Cap Value" in a slicer as shown below, it would create a new calculated column ("New_Change") where score value is calculated by the xx% (manually entered in a slicer) on a PowerBI page but it is not greater than "Cap Value" (manually entered in a slicer) .

The End table would look like this based on the values entered manually on a PowerBI page:
Thanks in advance!
Solved! Go to Solution.


- Mark as New
- Bookmark
- Subscribe
- Mute
- Subscribe to RSS Feed
- Permalink
- Report Inappropriate Content
Hi @ashishoza12345 ,
You cannot have values on a table being influenced by a slicer for this you need a measure, create parameters for each of the values of your selection and the add the following metric:
New Change =
VAR _NewChange =
    SELECTEDVALUE ( 'Table (2)'[Score] )
        * SWITCH (
            SELECTEDVALUE ( 'Table (2)'[Continent] ),
            "Africa", [Africa Value],
            "Asia", [Asia Value],
            "North America", [North America Value],
            "Europe", [Europe Value]
        )
RETURN
    IF ( _NewChange <= 30, _NewChange, 30 )
Regards
Miguel Félix
Did I answer your question? Mark my post as a solution!
Proud to be a Super User!
Check out my blog: Power BI em Português- Mark as New
- Bookmark
- Subscribe
- Mute
- Subscribe to RSS Feed
- Permalink
- Report Inappropriate Content
Hi @ashishoza12345 ,
Here is the file I have also change the metric a little bit so that the cap is dynamic based on the slicer wich I have forgotten in the previous version:
New Change =
VAR _NewChange =
    SELECTEDVALUE ( 'Table'[Score] )
        * SWITCH (
            SELECTEDVALUE ( 'Table'[Continent] ),
            "Africa", [Africa Value],
            "Asia", [Asia Value],
            "North America", [North America Value],
            "Europe", [Europe Value]
        )
RETURN
    IF ( _NewChange <= [CAP Value Value], _NewChange,[CAP Value Value] )
Regards
Miguel Félix
Did I answer your question? Mark my post as a solution!
Proud to be a Super User!
Check out my blog: Power BI em Português- Mark as New
- Bookmark
- Subscribe
- Mute
- Subscribe to RSS Feed
- Permalink
- Report Inappropriate Content
Hi @ashishoza12345 ,
On top of the metric you already have add the following measure:
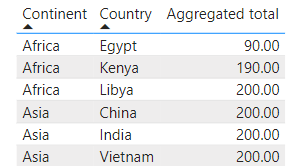
Aggregated total =
SUMX (
    SUMMARIZE (
        'Sample',
        'Sample'[Continent],
        'Sample'[Country],
        'Sample'[City],
        "NewChangeValue", [New Change]
    ),
    [NewChangeValue]
)
Regards
Miguel Félix
Did I answer your question? Mark my post as a solution!
Proud to be a Super User!
Check out my blog: Power BI em Português- Mark as New
- Bookmark
- Subscribe
- Mute
- Subscribe to RSS Feed
- Permalink
- Report Inappropriate Content
- Mark as New
- Bookmark
- Subscribe
- Mute
- Subscribe to RSS Feed
- Permalink
- Report Inappropriate Content
Hi @MFelix ,
Thank you so much for your valuable time and providning me this solution.
Really appreciate your effort! 🙂
Once again Thank you! 🙂
Kind Regards,
Ashish Oza.
- Mark as New
- Bookmark
- Subscribe
- Mute
- Subscribe to RSS Feed
- Permalink
- Report Inappropriate Content
Hi @ashishoza12345 ,
You cannot have values on a table being influenced by a slicer for this you need a measure, create parameters for each of the values of your selection and the add the following metric:
New Change =
VAR _NewChange =
    SELECTEDVALUE ( 'Table (2)'[Score] )
        * SWITCH (
            SELECTEDVALUE ( 'Table (2)'[Continent] ),
            "Africa", [Africa Value],
            "Asia", [Asia Value],
            "North America", [North America Value],
            "Europe", [Europe Value]
        )
RETURN
    IF ( _NewChange <= 30, _NewChange, 30 )
Regards
Miguel Félix
Did I answer your question? Mark my post as a solution!
Proud to be a Super User!
Check out my blog: Power BI em Português- Mark as New
- Bookmark
- Subscribe
- Mute
- Subscribe to RSS Feed
- Permalink
- Report Inappropriate Content
- Mark as New
- Bookmark
- Subscribe
- Mute
- Subscribe to RSS Feed
- Permalink
- Report Inappropriate Content
Hi @ashishoza12345 ,
Here is the file I have also change the metric a little bit so that the cap is dynamic based on the slicer wich I have forgotten in the previous version:
New Change =
VAR _NewChange =
    SELECTEDVALUE ( 'Table'[Score] )
        * SWITCH (
            SELECTEDVALUE ( 'Table'[Continent] ),
            "Africa", [Africa Value],
            "Asia", [Asia Value],
            "North America", [North America Value],
            "Europe", [Europe Value]
        )
RETURN
    IF ( _NewChange <= [CAP Value Value], _NewChange,[CAP Value Value] )
Regards
Miguel Félix
Did I answer your question? Mark my post as a solution!
Proud to be a Super User!
Check out my blog: Power BI em Português- Mark as New
- Bookmark
- Subscribe
- Mute
- Subscribe to RSS Feed
- Permalink
- Report Inappropriate Content
Hi @MFelix ,
Thank you so much for your kind response.
Actually, there has been a small change in the dataset where my PBI users would like to see aggregated figures on the PBI Page.
For Example, how do we check the continent numbers, if we have One more field City is added into the dataset:
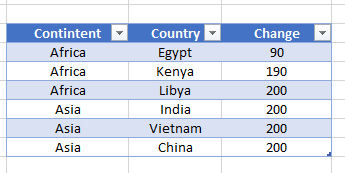
As shown below, if Cap Value is 100 & Change % for Africa & Asia is 20% & 30% respectively, then in the background that cap value is applied on each row and on the PBI Page we get to see the total of each continent where each City "Change" is not more than 100.

Based on using Cap Value as a filter "Change" field gets updated

On the PowerBI page we get like given below visual:
I have also shared the PBI link below:
https://drive.google.com/drive/folders/1S0yeeVEJyOeY8200Ct9z9o7zXccmbtuS?usp=sharing
Please let me know if you need any additional information.
Your help in this regard is highly apprecaited.
Kind Regards,
Ashish Oza.
- Mark as New
- Bookmark
- Subscribe
- Mute
- Subscribe to RSS Feed
- Permalink
- Report Inappropriate Content
Hi @ashishoza12345 ,
On top of the metric you already have add the following measure:
Aggregated total =
SUMX (
    SUMMARIZE (
        'Sample',
        'Sample'[Continent],
        'Sample'[Country],
        'Sample'[City],
        "NewChangeValue", [New Change]
    ),
    [NewChangeValue]
)
Regards
Miguel Félix
Did I answer your question? Mark my post as a solution!
Proud to be a Super User!
Check out my blog: Power BI em Português
Helpful resources

Microsoft Fabric Learn Together
Covering the world! 9:00-10:30 AM Sydney, 4:00-5:30 PM CET (Paris/Berlin), 7:00-8:30 PM Mexico City

Power BI Monthly Update - April 2024
Check out the April 2024 Power BI update to learn about new features.

Fabric Community Update - April 2024
Find out what's new and trending in the Fabric Community.

| User | Count |
|---|---|
| 102 | |
| 101 | |
| 78 | |
| 69 | |
| 63 |


| User | Count |
|---|---|
| 141 | |
| 106 | |
| 101 | |
| 85 | |
| 72 |


