FabCon is coming to Atlanta
Join us at FabCon Atlanta from March 16 - 20, 2026, for the ultimate Fabric, Power BI, AI and SQL community-led event. Save $200 with code FABCOMM.
Register now!- Power BI forums
- Get Help with Power BI
- Desktop
- Service
- Report Server
- Power Query
- Mobile Apps
- Developer
- DAX Commands and Tips
- Custom Visuals Development Discussion
- Health and Life Sciences
- Power BI Spanish forums
- Translated Spanish Desktop
- Training and Consulting
- Instructor Led Training
- Dashboard in a Day for Women, by Women
- Galleries
- Data Stories Gallery
- Themes Gallery
- Contests Gallery
- QuickViz Gallery
- Quick Measures Gallery
- Visual Calculations Gallery
- Notebook Gallery
- Translytical Task Flow Gallery
- TMDL Gallery
- R Script Showcase
- Webinars and Video Gallery
- Ideas
- Custom Visuals Ideas (read-only)
- Issues
- Issues
- Events
- Upcoming Events
The Power BI Data Visualization World Championships is back! Get ahead of the game and start preparing now! Learn more
- Power BI forums
- Forums
- Get Help with Power BI
- Desktop
- Re: Calculate the variance between two (variable) ...
- Subscribe to RSS Feed
- Mark Topic as New
- Mark Topic as Read
- Float this Topic for Current User
- Bookmark
- Subscribe
- Printer Friendly Page
- Mark as New
- Bookmark
- Subscribe
- Mute
- Subscribe to RSS Feed
- Permalink
- Report Inappropriate Content
Calculate the variance between two (variable) selections
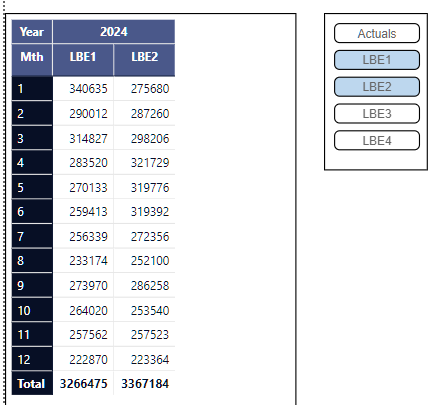
I have this simplified view:
As you can see now LBE1 and LBE2 are selected.
I want to ad a 3rd field (measure) which will give the variance between the selections.
The slicer on the right is based on a field in the data, so each row in the data has one of these 5 in a column named 'Type'.
How can I make a measure that subtracts the value belonging with LBE2 with the value beloning with LBE1.
And of course if I select LBE2 and LBE3 or even LBE1 and LBE3 (LBE3, LBE4 etc etc) it still would work and subtract the values belonging to that combination.
- Mark as New
- Bookmark
- Subscribe
- Mute
- Subscribe to RSS Feed
- Permalink
- Report Inappropriate Content
Thanks @Anonymous but you made a "fixed" solution where you compare LBE2 with LBE1, but the user can make every selection from the slicer. So also LBE3 with LBE1 or LBE2 with LBE3.
Also in your measure you are treating field addendum as a field of a table in the averagex. But it is not a table field it is a measure.
I compiled a sample workbook here so you can see the general setup and data (real file is much bigger and complex but these fields and relations are needed for that visual) :
https://drive.google.com/file/d/10VpjOCSx1eyqixI14mklcSlL-Cti0Y-e/view?usp=sharing
So I have field parameter to switch between the value fields (prmValueSelection) and a slicer for the Type in which user can select LBE1, LBE2, LBE3 etc.
The goal now is when 2 types are selected to get the difference in selected value of these two types.
(user should not select more then 2 but if he/she does result should just be blank, 0, error or whatever message)
I do not think it can be done but if somebody could find a way to achieve this that would be great.
- Mark as New
- Bookmark
- Subscribe
- Mute
- Subscribe to RSS Feed
- Permalink
- Report Inappropriate Content
Well maybe it is just not possible with the current data setup.
How would you guys do something like this?
How would your data look?
Cannot be the first one that wants to look at his data in this way?? 🤔
- Mark as New
- Bookmark
- Subscribe
- Mute
- Subscribe to RSS Feed
- Permalink
- Report Inappropriate Content
Hi, @rpinxt
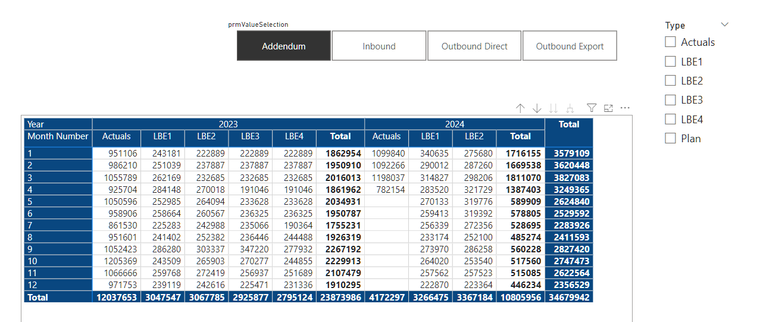
You can implement the calculation variance in total. I've tried adding another measure to the matrix, but that would have it in every column of the matrix:
As you can see, while the variance of the selected two can be successfully calculated, this will put the measure of this variance into the columns of each matrix.
Instead, you can calculate the variance for two columns in the matrix and display it in the total.
Sum of Addendum =
IF (
    NOT HASONEVALUE ( 'Table'[Type] ),
    AVERAGEX (
        'Table',
        CALCULATE ( SUM ( 'Table'[Addendum] ), 'Table'[Type] = "LBE1" )
            - CALCULATE ( SUM ( 'Table'[Addendum] ), 'Table'[Type] = "LBE2" )
    ),
    SUM ( 'Table'[Addendum] )
)
You can then control your slicer options, check the two columns you want to show variance, and uncheck the other columns. I've provided the PBIX file used this time below.
How to Get Your Question Answered Quickly
If it does not help, please provide more details with your desired output and pbix file without privacy information (or some sample data) .
Best Regards
Jianpeng Li
If this post helps, then please consider Accept it as the solution to help the other members find it more quickly.
- Mark as New
- Bookmark
- Subscribe
- Mute
- Subscribe to RSS Feed
- Permalink
- Report Inappropriate Content
Maybe harder then I thought.
Can it not be done?
Or every other way to do this would be appreciated to.
Would think there would be somekind of formula to show variance in a matrix.
- Mark as New
- Bookmark
- Subscribe
- Mute
- Subscribe to RSS Feed
- Permalink
- Report Inappropriate Content
Maybe posting the underlying data will help to get this solved.
| Year | Mth | Type | Addendum |
| 2024 | 1 | LBE1 | 340635 |
| 2024 | 1 | LBE2 | 275680 |
| 2024 | 2 | LBE1 | 290012 |
| 2024 | 2 | LBE2 | 287260 |
| 2024 | 3 | LBE1 | 314827 |
| 2024 | 3 | LBE2 | 298206 |
| 2024 | 4 | LBE1 | 283520 |
| 2024 | 4 | LBE2 | 321729 |
| 2024 | 5 | LBE1 | 270133 |
| 2024 | 5 | LBE2 | 319776 |
| 2024 | 6 | LBE1 | 259413 |
| 2024 | 6 | LBE2 | 319392 |
| 2024 | 7 | LBE1 | 256339 |
| 2024 | 7 | LBE2 | 272356 |
| 2024 | 8 | LBE1 | 233174 |
| 2024 | 8 | LBE2 | 252100 |
| 2024 | 9 | LBE1 | 273970 |
| 2024 | 9 | LBE2 | 286258 |
| 2024 | 10 | LBE1 | 264020 |
| 2024 | 10 | LBE2 | 253540 |
| 2024 | 11 | LBE1 | 257562 |
| 2024 | 11 | LBE2 | 257523 |
| 2024 | 12 | LBE1 | 222870 |
| 2024 | 12 | LBE2 | 223364 |
Helpful resources

Power BI Dataviz World Championships
The Power BI Data Visualization World Championships is back! Get ahead of the game and start preparing now!

| User | Count |
|---|---|
| 61 | |
| 43 | |
| 40 | |
| 38 | |
| 22 |
| User | Count |
|---|---|
| 178 | |
| 125 | |
| 116 | |
| 77 | |
| 54 |


