Join us at FabCon Vienna from September 15-18, 2025
The ultimate Fabric, Power BI, SQL, and AI community-led learning event. Save €200 with code FABCOMM.
Get registered- Power BI forums
- Get Help with Power BI
- Desktop
- Service
- Report Server
- Power Query
- Mobile Apps
- Developer
- DAX Commands and Tips
- Custom Visuals Development Discussion
- Health and Life Sciences
- Power BI Spanish forums
- Translated Spanish Desktop
- Training and Consulting
- Instructor Led Training
- Dashboard in a Day for Women, by Women
- Galleries
- Data Stories Gallery
- Themes Gallery
- Contests Gallery
- Quick Measures Gallery
- Notebook Gallery
- Translytical Task Flow Gallery
- TMDL Gallery
- R Script Showcase
- Webinars and Video Gallery
- Ideas
- Custom Visuals Ideas (read-only)
- Issues
- Issues
- Events
- Upcoming Events
Enhance your career with this limited time 50% discount on Fabric and Power BI exams. Ends September 15. Request your voucher.
- Power BI forums
- Forums
- Get Help with Power BI
- Desktop
- Calculate the difference between two columns in a ...
- Subscribe to RSS Feed
- Mark Topic as New
- Mark Topic as Read
- Float this Topic for Current User
- Bookmark
- Subscribe
- Printer Friendly Page
- Mark as New
- Bookmark
- Subscribe
- Mute
- Subscribe to RSS Feed
- Permalink
- Report Inappropriate Content
Calculate the difference between two columns in a multi level matrix
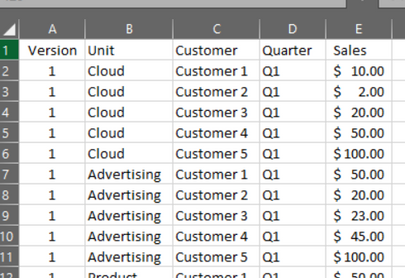
Here is the source data:
Here are the potential values:
Here is the output matrix in Power BI:
Here are the Power BI Visualizations and Fields:
I would like to create a measure to calculate the difference between Version 1 and 2 like this (Columns E and H):
Note: This report will change version and quarter filters so the Delta needs to recalcultate. Thanks for any help!
- Mark as New
- Bookmark
- Subscribe
- Mute
- Subscribe to RSS Feed
- Permalink
- Report Inappropriate Content
Create three measure Sales V1, Sales v2 and Diff and use them?
V1 = calculate(sum(sales), version ="V1")
V2 = calculate(sum(sales), version ="V2")
Diff = V2-V1
Appreciate your Kudos. In case, this is the solution you are looking for, mark it as the Solution. In case it does not help, please provide additional information and mark me with @
Thanks. My Recent Blog -
https://community.powerbi.com/t5/Community-Blog/Winner-Topper-on-Map-How-to-Color-States-on-a-Map-wi...
https://community.powerbi.com/t5/Community-Blog/HR-Analytics-Active-Employee-Hire-and-Termination-tr...
https://community.powerbi.com/t5/Community-Blog/Power-BI-Working-with-Non-Standard-Time-Periods/ba-p...
https://community.powerbi.com/t5/Community-Blog/Comparing-Data-Across-Date-Ranges/ba-p/823601
- Mark as New
- Bookmark
- Subscribe
- Mute
- Subscribe to RSS Feed
- Permalink
- Report Inappropriate Content
This works great if I only have V1 and V2. However, I need it dynamic. What if I have 10 versions and need to compare sales in V2 vs V5? This could end up requiring 20+ calculation columns, any idea how to get around this?
- Mark as New
- Bookmark
- Subscribe
- Mute
- Subscribe to RSS Feed
- Permalink
- Report Inappropriate Content
Create 2 version table. Join both of them with main table with disabled join. The create formula using userelation and then subract.
Use both slicer in UI.
How to use userelation, check


