cancel
Showing results for 
Search instead for 
Did you mean: 

A new Data Days event is coming soon! This time we’re going bigger than ever. Fabric, Power BI, SQL, AI and more. Don't miss out.

Reply
NadiaLR1234
Helper I
Helper I

Calculate difference based on text column

Hi

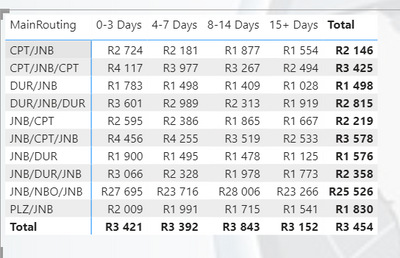
Is there a way for me to calculate the difference between averages on the below senario ?

I have 4 groups (0-3 Days, 4-7 Days, 8-14 Days and 15+ Days) - I want to calculate what the difference between any specified group is - so example difference between Avg 0-3 Days and Avg 4-7 Days will be on first line -543 etc - how do I write the dax measure/column to calculate this difference ? even if I have to have multiples that is fine as long as it gives the correct difference ?


NadiaLR1234_0-1660661039451.png


1 ACCEPTED SOLUTION

hi again, 

Please look at this pbix example in the following LINK 


Did I answer your question? Mark my post as a solution! Appreciate your Kudos!! ;-
Best Regards
BC


Best regards


Bruno Costa | Super User


Did I help you to answer your question? Accepted my post as a solution! Appreciate your Kudos!! 


Take a look at the blog: PBI Portugal 


View solution in original post

6 REPLIES 6
NadiaLR1234
Helper I
Helper I

Hi - I need to show the difference between the different categories so I can show the lost/gained savings on each category  and then when they move a certain % over to a selected one what the difference will be

Hello again NadiaLR1234

Can you share a draft of the pretended output 
The 4 groups are column in the model? 
we need to do all difference ?

  • 0-3 Days vs 4-7 Days
  • 0-3 Days vs 8-14 Days
  • 0-3 Days vs 15+ Days
  • 4-7 Days vs  8-14 Days
  • 4-7 Days vs 15+ Days
  • 8-14 Days vs 15+ Days


BR

Bruno 


Best regards


Bruno Costa | Super User


Did I help you to answer your question? Accepted my post as a solution! Appreciate your Kudos!! 


Take a look at the blog: PBI Portugal 


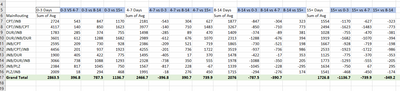
Something like this ? 


NadiaLR1234_0-1660807417415.png


hi again, 

Please look at this pbix example in the following LINK 


Did I answer your question? Mark my post as a solution! Appreciate your Kudos!! ;-
Best Regards
BC


Best regards


Bruno Costa | Super User


Did I help you to answer your question? Accepted my post as a solution! Appreciate your Kudos!! 


Take a look at the blog: PBI Portugal 


Thank you will try it this way

onurbmiguel_
Power Participant
Power Participant

Hello NadiaLR1234, 

You need to  create independent measures, but why do you need all the difference? 
It will be some measures, and how the values must appear to the users? 
How the total will work?

Why not to expose this information in a visual / graph that explain to users the up and down of values.


BR 

Bruno


Best regards


Bruno Costa | Super User


Did I help you to answer your question? Accepted my post as a solution! Appreciate your Kudos!! 


Take a look at the blog: PBI Portugal 


Helpful resources

Announcements
May Power BI Update Carousel

Power BI Monthly Update - May 2026

Check out the May 2026 Power BI update to learn about new features.

Fabric SQL PBI Data Days

Data Days 2026 coming soon!

Sign up to receive a private message when registration opens and key events begin.

New to Fabric survey Carousel

New to Fabric Survey

If you have recently started exploring Fabric, we'd love to hear how it's going. Your feedback can help with product improvements.

Power BI DataViz World Championships carousel

Power BI DataViz World Championships - June 2026

A new Power BI DataViz World Championship is coming this June! Don't miss out on submitting your entry.