Fabric Data Days starts November 4th!
Advance your Data & AI career with 50 days of live learning, dataviz contests, hands-on challenges, study groups & certifications and more!
Get registered- Power BI forums
- Get Help with Power BI
- Desktop
- Service
- Report Server
- Power Query
- Mobile Apps
- Developer
- DAX Commands and Tips
- Custom Visuals Development Discussion
- Health and Life Sciences
- Power BI Spanish forums
- Translated Spanish Desktop
- Training and Consulting
- Instructor Led Training
- Dashboard in a Day for Women, by Women
- Galleries
- Data Stories Gallery
- Themes Gallery
- Contests Gallery
- QuickViz Gallery
- Quick Measures Gallery
- Visual Calculations Gallery
- Notebook Gallery
- Translytical Task Flow Gallery
- TMDL Gallery
- R Script Showcase
- Webinars and Video Gallery
- Ideas
- Custom Visuals Ideas (read-only)
- Issues
- Issues
- Events
- Upcoming Events
Get Fabric Certified for FREE during Fabric Data Days. Don't miss your chance! Request now
- Power BI forums
- Forums
- Get Help with Power BI
- Desktop
- Re: Calculate Quarters and add them to matrix
- Subscribe to RSS Feed
- Mark Topic as New
- Mark Topic as Read
- Float this Topic for Current User
- Bookmark
- Subscribe
- Printer Friendly Page
- Mark as New
- Bookmark
- Subscribe
- Mute
- Subscribe to RSS Feed
- Permalink
- Report Inappropriate Content
Calculate Quarters and add them to matrix
Hi all,
I have made the matrix below but I not sure on how can I fill some columns e.g. quarters. Probably I will need measures but again not sure how to use them or how to put them in the vizualization tab in order to present them correctly.
This is my final output, the matrix that I want to create in my dashboard
The tables that I use is the ones here and another one that contains only the Accounts - Subaccounts - Subsubaccounts etc.
The relations between the tables is here
My visuals options is this
I created the measure which I think is the correct one (if not please tell me)
Solved! Go to Solution.
- Mark as New
- Bookmark
- Subscribe
- Mute
- Subscribe to RSS Feed
- Permalink
- Report Inappropriate Content
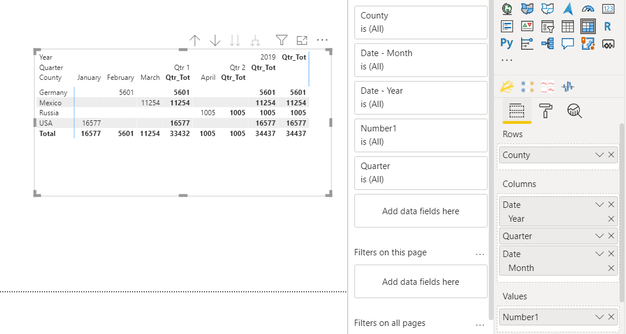
@Anonymous Why don't you try the below option. You will need to create a quarter column (Quarter = Append1[Date].[Quarter] )
and put it between year and month. You can modify the column header from the format option to show it as quarter total.
Did I answer your question? Mark my post as a solution!
Appreciate your Kudos
Proud to be a Super User!
Follow me on linkedin
- Mark as New
- Bookmark
- Subscribe
- Mute
- Subscribe to RSS Feed
- Permalink
- Report Inappropriate Content
@Anonymous , As you have date you can use datesQtd and date table for this and prior qtr
example
QTD Sales = CALCULATE(SUM(Sales[Sales Amount]),DATESQTD(('Date'[Date])))
Last QTD Sales = CALCULATE(SUM(Sales[Sales Amount]),DATESQTD(dateadd('Date'[Date],-1,QUARTER)))
Last complete QTD Sales = CALCULATE(SUM(Sales[Sales Amount]),DATESQTD( ENDOFQUARTER(dateadd('Date'[Date],-1,QUARTER))))
Last to last QTD Sales = CALCULATE(SUM(Sales[Sales Amount]),DATESQTD(dateadd('Date'[Date],-2,QUARTER)))
Next QTD Sales = CALCULATE(SUM(Sales[Sales Amount]),DATESQTD(dateadd('Date'[Date],1,QUARTER)))
Last year same QTD Sales = CALCULATE(SUM(Sales[Sales Amount]),DATESQTD(dateadd('Date'[Date],-1,Year)))
The disply you have provided in the first image in not possible.
refer blog from Greg and Paul for Hybrid display with Matrix Column and measure
https://community.powerbi.com/t5/Community-Blog/Creating-a-custom-or-hybrid-matrix-in-PowerBI/ba-p/1354591
https://community.powerbi.com/t5/Quick-Measures-Gallery/The-New-Hotness-Custom-Matrix-Hierarchy/m-p/963588#M428
vote for Hybrid Table
https://ideas.powerbi.com/ideas/idea/?ideaid=9bc32b23-1eb1-4e74-8b34-349887b37ebc
To get the best of the time intelligence function. Make sure you have a date calendar and it has been marked as the date in model view. Also, join it with the date column of your fact/s. Refer :radacad sqlbi My Video Series Appreciate your Kudos.
Please provide your feedback comments and advice for new videos
Tutorial Series Dax Vs SQL Direct Query PBI Tips
Appreciate your Kudos.
Helpful resources

Fabric Data Days
Advance your Data & AI career with 50 days of live learning, contests, hands-on challenges, study groups & certifications and more!

Power BI Monthly Update - October 2025
Check out the October 2025 Power BI update to learn about new features.


