FabCon is coming to Atlanta
Join us at FabCon Atlanta from March 16 - 20, 2026, for the ultimate Fabric, Power BI, AI and SQL community-led event. Save $200 with code FABCOMM.
Register now!- Power BI forums
- Get Help with Power BI
- Desktop
- Service
- Report Server
- Power Query
- Mobile Apps
- Developer
- DAX Commands and Tips
- Custom Visuals Development Discussion
- Health and Life Sciences
- Power BI Spanish forums
- Translated Spanish Desktop
- Training and Consulting
- Instructor Led Training
- Dashboard in a Day for Women, by Women
- Galleries
- Data Stories Gallery
- Themes Gallery
- Contests Gallery
- Quick Measures Gallery
- Notebook Gallery
- Translytical Task Flow Gallery
- TMDL Gallery
- R Script Showcase
- Webinars and Video Gallery
- Ideas
- Custom Visuals Ideas (read-only)
- Issues
- Issues
- Events
- Upcoming Events
To celebrate FabCon Vienna, we are offering 50% off select exams. Ends October 3rd. Request your discount now.
- Power BI forums
- Forums
- Get Help with Power BI
- Desktop
- Box and Whiskers (JP) Visual not filtering properl...
- Subscribe to RSS Feed
- Mark Topic as New
- Mark Topic as Read
- Float this Topic for Current User
- Bookmark
- Subscribe
- Printer Friendly Page
- Mark as New
- Bookmark
- Subscribe
- Mute
- Subscribe to RSS Feed
- Permalink
- Report Inappropriate Content
Box and Whiskers (JP) Visual not filtering properly
I am uncertain if I am doing something wrong....
For the most part everything seems to be working fine. Category is "Source", sampling is an individual ID, Values is a median of Scores. Everything looks great. Here it is prior to filtering.
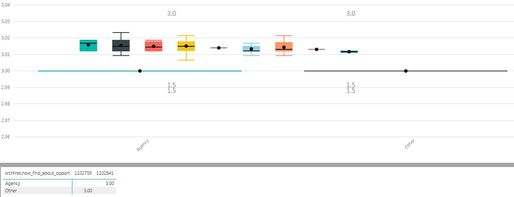
But then I choose a year and a division slicer. That generally works everywhere across the board. And it clearly knows what it's supposed to be looking at because it is showing the correct data points. See those two single samples? Those are the only data points in this visual. So the question is, why is it displaying all those other elements (the multicolored Box and Whiskers above the flat data points)? You can see just below where I have Show Data on and there are only two points of data.
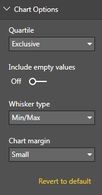
Then what makes me think it may not be me, is that when I go into the Vizualization properties and in the Chart options I turn "Include Empty Values" On then Off again, it displays what it should...
But when I deselect the slicers and reapply the slicers it goes back to having the extra elements on there.
I did update (and generally update Power BI month to month).
Anything I can do to fix this? I don't think it's a data issue.
Best regards,
~Don
Solved! Go to Solution.
- Mark as New
- Bookmark
- Subscribe
- Mute
- Subscribe to RSS Feed
- Permalink
- Report Inappropriate Content
FYI I rebuilt the visual a few times and eventually it worked. I don't think I did anything different each time but I suppose I will never know unless I see this again.
Thanks all for your input.
~Don
- Mark as New
- Bookmark
- Subscribe
- Mute
- Subscribe to RSS Feed
- Permalink
- Report Inappropriate Content
Hi @don_writer,
Based on my test, it seemed work normally on my side:
Would you please share your pbix file if possible? Also you can test with our sample report on your side to see if the same issue occurs.
Regards,
Daniel He
If this post helps, then please consider Accept it as the solution to help the other members find it more quickly.


