FabCon is coming to Atlanta
Join us at FabCon Atlanta from March 16 - 20, 2026, for the ultimate Fabric, Power BI, AI and SQL community-led event. Save $200 with code FABCOMM.
Register now!- Power BI forums
- Get Help with Power BI
- Desktop
- Service
- Report Server
- Power Query
- Mobile Apps
- Developer
- DAX Commands and Tips
- Custom Visuals Development Discussion
- Health and Life Sciences
- Power BI Spanish forums
- Translated Spanish Desktop
- Training and Consulting
- Instructor Led Training
- Dashboard in a Day for Women, by Women
- Galleries
- Data Stories Gallery
- Themes Gallery
- Contests Gallery
- QuickViz Gallery
- Quick Measures Gallery
- Visual Calculations Gallery
- Notebook Gallery
- Translytical Task Flow Gallery
- TMDL Gallery
- R Script Showcase
- Webinars and Video Gallery
- Ideas
- Custom Visuals Ideas (read-only)
- Issues
- Issues
- Events
- Upcoming Events
Get Fabric Certified for FREE during Fabric Data Days. Don't miss your chance! Request now
- Power BI forums
- Forums
- Get Help with Power BI
- Desktop
- Re: Beneficiary Model - Fact Table Does Not Proper...
- Subscribe to RSS Feed
- Mark Topic as New
- Mark Topic as Read
- Float this Topic for Current User
- Bookmark
- Subscribe
- Printer Friendly Page
- Mark as New
- Bookmark
- Subscribe
- Mute
- Subscribe to RSS Feed
- Permalink
- Report Inappropriate Content
Beneficiary Model - Fact Table Does Not Properly Filter Beneficiary Table
Hello Community -
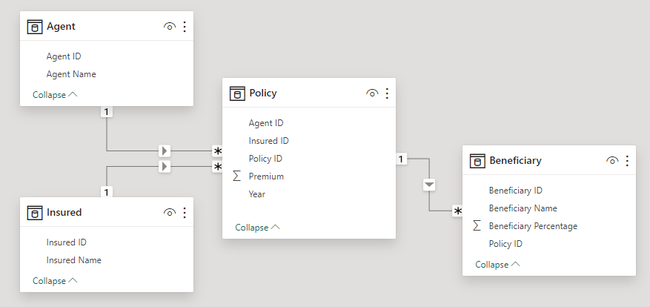
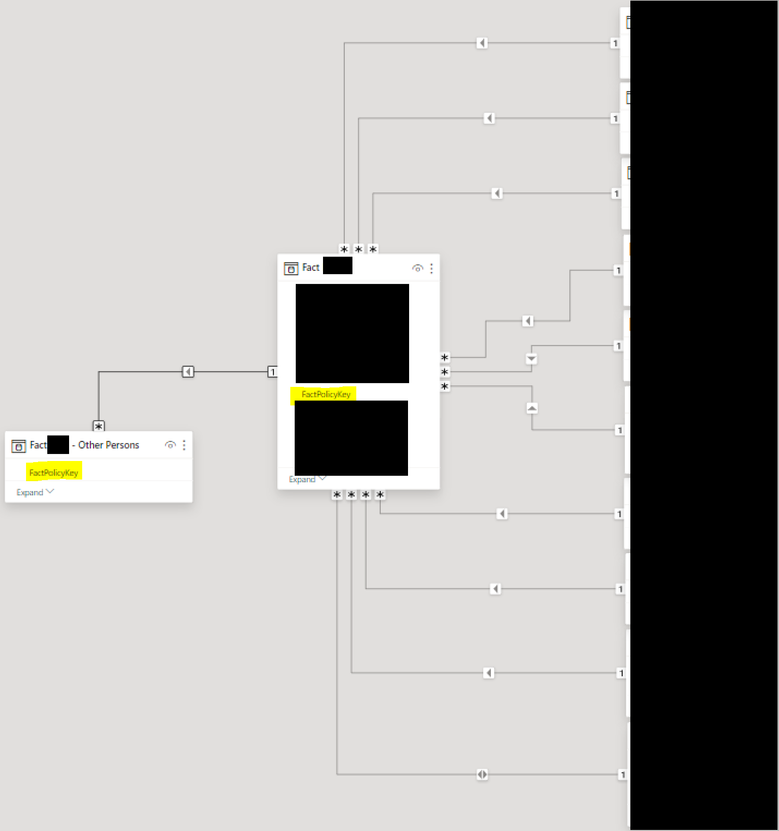
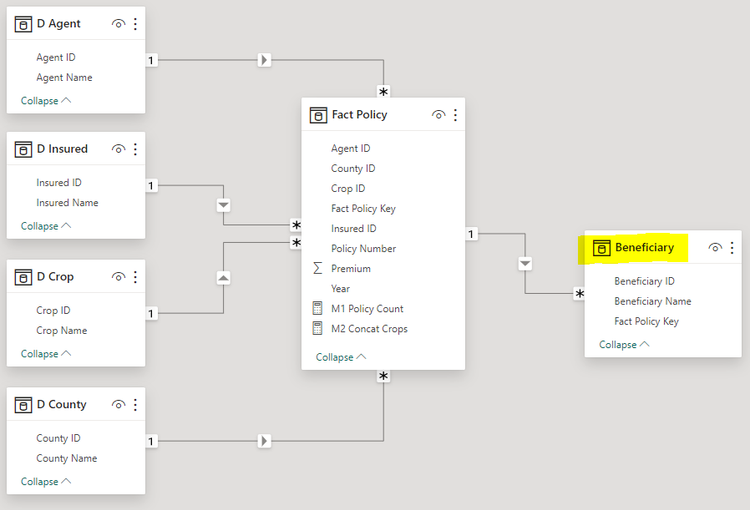
I have 2 models where the "Fact" table has a 1:* relationship with a "Beneficiary" table.
Each Policy ID should only appear in the Fact table once.
However, a single Policy ID could have any number of Beneficiaries in the "Beneficiary" table.
1) Test Model - works just fine
2) Real Model - does not work
TEST MODEL DETAILS
REAL MODEL DETAILS
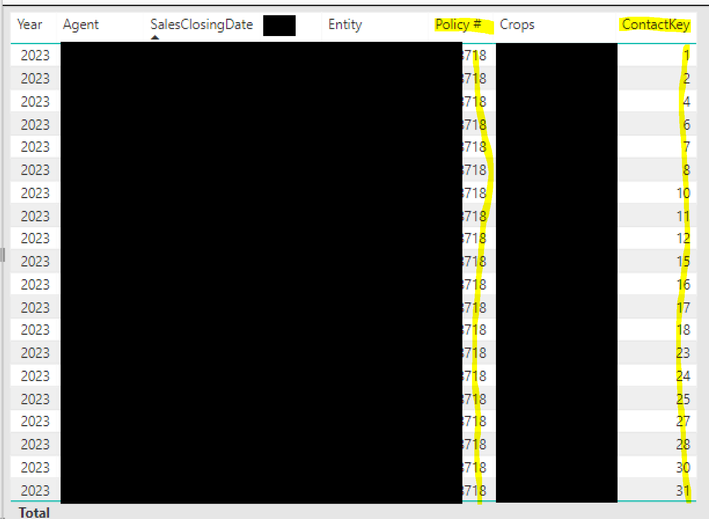
When filtering a table visual for a policy # ending in "...718", I correctly see only 1 row in the table as expected.
However, when adding any field (e.g. "ContactKey") from the new "Beneficiary" table (i.e. "Fact **** - Other Persons), the table visual "explodes" from 1 row to over 300K rows (the number of rows in the "Beneficiary" table). All of the data in the previous screenshot is repeated for every single record in the "Beneficiary" table. Even though there is clearly a relationship between the Fact table & the Beneficiary table, the table visual data is displayed as if no relationship exists. Why is this?
The relationship appears correct in the model.
But it's clearly not working in the table visual.
Any ideas?
Regards,
Nathan
Solved! Go to Solution.
- Mark as New
- Bookmark
- Subscribe
- Mute
- Subscribe to RSS Feed
- Permalink
- Report Inappropriate Content
Hey @WinterMist ,
regarding
1) use CROSSFILTER( ..., ..., BOTH) to create a dedicated measure instead of changing the cross-filter direction
2) I think it will be a great read
3) I do not think I will spend this time to write about this type of relationships here, maybe I will write an article on my site. But, it is obvious (from my perspective) as the measure makes the second table "explode".
Regards,
Tom
Did I answer your question? Mark my post as a solution, this will help others!
Proud to be a Super User!
I accept Kudos 😉
Hamburg, Germany
- Mark as New
- Bookmark
- Subscribe
- Mute
- Subscribe to RSS Feed
- Permalink
- Report Inappropriate Content
Yes, that would be fine to use the sample PBIX in an article if you wish.
Thanks especially for the recommendation to use:
"CROSSFILTER( ..., ..., BOTH) to create a dedicated measure instead of changing the cross-filter direction"
Thanks again for your time.
Regards,
Nathan
- Mark as New
- Bookmark
- Subscribe
- Mute
- Subscribe to RSS Feed
- Permalink
- Report Inappropriate Content
1) So the bi-directional relationship does fix the issue. However, I am one of those people who typically runs into other adverse problems caused from using bidirectional; and I later have to remove it. So although I will mark this as a solution, doing this gives me a great deal of uneasiness. (If there was a way to resolve this via the measure, I would much prefer doing it that way.)
2) I added your book recommendation to my Amazon list. Thanks for that.
3) I am most intrigued by your comment on how measures create relationships that do not exist within our models. Specifically, you wrote that my measure is creating a relationship between:
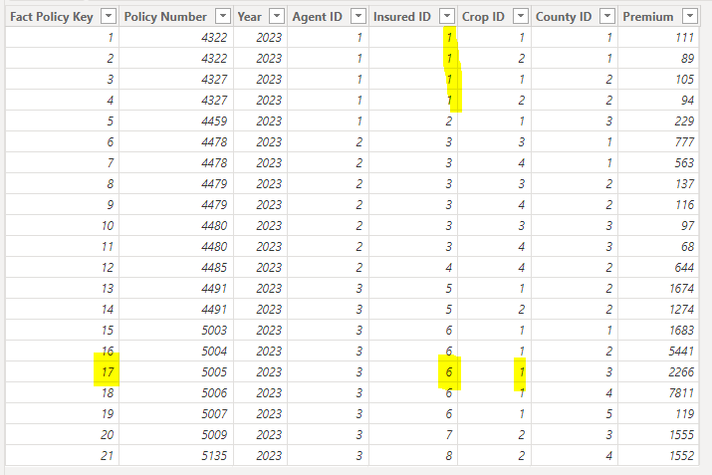
"Insured 1" and beneficiary "Sid" via the bond of "Corn" (Fact Policy Key 17).
Would you be able to educate me any further on how this is happening?
I believe you; but when I look at the Fact table, this makes no sense to me at all.
"Insured 1" should not connect with Fact Policy Key 17 at all.
Definitely not understanding how the measure is causing Insured 1 to form a relationship with ALL beneficiaries.
Is there a way for me to write the measure differently to prevent this?
Regards,
Nathan
- Mark as New
- Bookmark
- Subscribe
- Mute
- Subscribe to RSS Feed
- Permalink
- Report Inappropriate Content
Hey @WinterMist ,
regarding
1) use CROSSFILTER( ..., ..., BOTH) to create a dedicated measure instead of changing the cross-filter direction
2) I think it will be a great read
3) I do not think I will spend this time to write about this type of relationships here, maybe I will write an article on my site. But, it is obvious (from my perspective) as the measure makes the second table "explode".
Regards,
Tom
Did I answer your question? Mark my post as a solution, this will help others!
Proud to be a Super User!
I accept Kudos 😉
Hamburg, Germany
- Mark as New
- Bookmark
- Subscribe
- Mute
- Subscribe to RSS Feed
- Permalink
- Report Inappropriate Content
Hey @WinterMist ,
can I use your sample pbix if I decide to write an article and publish the article on my website (minceddata.info) and will provide a download link to the pbix that points to my OneDrive, of course I will provide a link to this discussion and I will mention that the pbix was first published here?
Regards,
Tom
Did I answer your question? Mark my post as a solution, this will help others!
Proud to be a Super User!
I accept Kudos 😉
Hamburg, Germany
- Mark as New
- Bookmark
- Subscribe
- Mute
- Subscribe to RSS Feed
- Permalink
- Report Inappropriate Content
Hey @WinterMist ,
I assume you are looking for this:
To achieve the above, I "simply" changed the cross-filter direction of the relationship between the "fact policy" and the "beneficiary" table from "Single" to "Both."
The powers of a measure are manifold; everything we love about measures boils down to reaping insights from our data. But there is something to measures that I consider to be on the darker side of the super powers. This is the creation of relationships, even if they do not exist within our models, e.g., the relationship between: "Insured 1" and beneficiary "Sid." The "bond" that ties these objects together is "Corn" (here, it's the fact policy key 17).
First, you find the two beneficiaries, "Sam" and "Samantha" (tied to "Insurer 1"), and then you ask what the crop is. It becomes necessary to transform the table into a "kind of" dimension table to keep the beneficiaries. This can be achieved by changing the cross-filter direction.
Keep in mind that there are a lot of people out there who consider having a cross-filter of value both:
- bad practice
- a bad data model
- evidence of poor understanding
I consider having relationships with cross-filter direction "Both" a subtle dark art, like the 5-fingers death punch.
Hopefully, this will help you find what you are looking for.
Regards,
Tom
P.S.: there is no name for a table filtered by a fact table, but I consider the beneficiary table not a fact table. I am not sure if you know the book "(The Complete Reference) Star Schema" by Christopher Adamson. I consider this book essential.
Did I answer your question? Mark my post as a solution, this will help others!
Proud to be a Super User!
I accept Kudos 😉
Hamburg, Germany
- Mark as New
- Bookmark
- Subscribe
- Mute
- Subscribe to RSS Feed
- Permalink
- Report Inappropriate Content
Thanks again for your time.
Here is a link to the PBIX.
https://drive.google.com/file/d/1USKah9XhEV5--ajUYh2ZMccMWlrHeR2Z/view?usp=sharing
To replicate the issue:
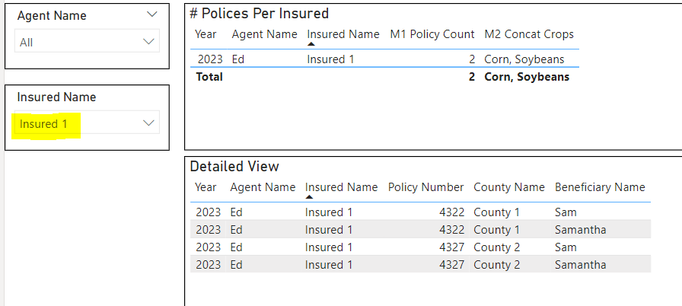
1) Set "Insured Name" slicer = Insured 1
- This will correctly isolate 1 row in the first table visual & 4 rows in the second table visual.
- So far no problems.
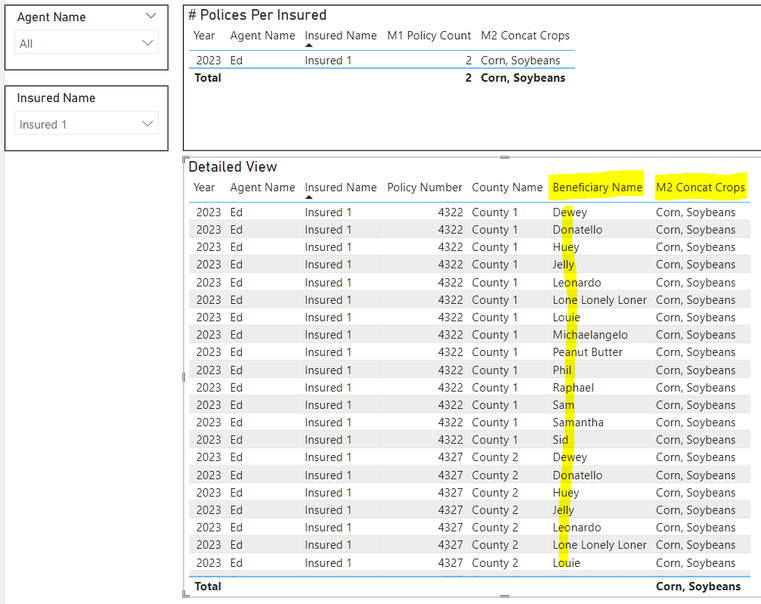
2) Drag the measure [M2 Concat Crops] onto the second table.
DESIRED RESULT: The detailed view should continue to show the same applicable 4 rows (per the above screenshot), except that the [M2 Concat Crops] measure should also appear as an additional column, showing "Corn, Soybeans" for all 4 rows.
UNDESIRED RESULT: As long as BOTH of the following items are present in the same table visual,
then the problem occurs:
1) 'Beneficiary'[Beneficiary Name]
2) [M2 Concat Crops]
If either item is removed from the table visual, then the problem goes away.
The problem is that ALL Beneficiary Names come into the visual, even the Beneficiary Names which have no relationship with "Insured 1"; and all other data is simply repeated for every single Beneficiary Name value.
Regards,
Nathan
P.S. Minor side question.
- I am familiar with "Fact" & "Dimension" categories of tables.
- But is there a category name for a table that is filtered by the "Fact" table? I don't even know what to call it. I wouldn't call it a Fact or a Dimension.
- Mark as New
- Bookmark
- Subscribe
- Mute
- Subscribe to RSS Feed
- Permalink
- Report Inappropriate Content
Thanks very much for your response.
1 step closer.
The REAL MODEL table visual has fields from:
- multiple Dimensions
- the Fact Table
- 1 measure which is a concatenated list of Crops from the Crop dimension.
I compared this to the TEST MODEL, which has table visual fields from:
- multiple Dimensions
- the Fact Table
I realized the only high level difference is that the TEST MODEL does not have the measure (which concatenates the values of a dimension).
As a test, I removed the measure from the table visual and the problem goes away.
So I have determined that the issue only occurs when BOTH of the following are true:
1) The measure is present in the table visual AND
2) At least 1 field from the Beneficiary table is present in the table visual
So in the REAL model:
'D Crop'[CropKey] filters 'Fact'[CropKey]
'Fact'[FactPolicyKey] filters 'Fact **** - Other Persons'[FactPolicyKey]
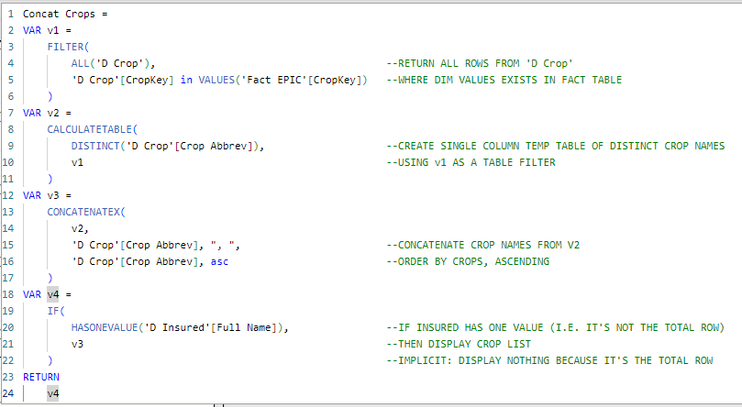
The purpose of the measure is simply to concatenate the crops for a given row.
For example, Policy # "12345" might have 2 crops (Corn & Soybeans).
IF 'D Crop'[Crop Name] is used, then the table visual displays this 1 Policy # over 2 rows (1 row for each crop).
IF instead, the measure is used, it concatenates "Corn, Soybeans" together so that this data is displayed on only 1 row in the table visual (which is a business requirement).
Once again, this measure has been working fine in the table visual all along.
It was only when I added a field from the newly added Beneficiary table ("Fact **** - Other Persons) that the table visual breaks.
Hoping you are able to see an issue with my measure?
Regards,
Nathan
- Mark as New
- Bookmark
- Subscribe
- Mute
- Subscribe to RSS Feed
- Permalink
- Report Inappropriate Content
Hey @WinterMist ,
I'm not smart enough to create a solution by staring at blacked-out screenshots and measure text that provides a fix for a realtionship issue, a measure issue, or a combination of both.
I can not spend more time, if you are not able to spend time to create a pbix with sample data.
Regards,
Tom
Did I answer your question? Mark my post as a solution, this will help others!
Proud to be a Super User!
I accept Kudos 😉
Hamburg, Germany
- Mark as New
- Bookmark
- Subscribe
- Mute
- Subscribe to RSS Feed
- Permalink
- Report Inappropriate Content
Hey @WinterMist ,
without a model with sample data, it's almost impossible to provide guidance.
But one thing you must check is this, make sure that the table visual is using columns from the dimension tables. I consider it not surprising if add columns from the many side of a relationship to a table visual that the number of the rows is growing.
I'm sorry that I can not provide more help.
Regards,
Tom
Did I answer your question? Mark my post as a solution, this will help others!
Proud to be a Super User!
I accept Kudos 😉
Hamburg, Germany
Helpful resources

Power BI Monthly Update - November 2025
Check out the November 2025 Power BI update to learn about new features.

Fabric Data Days
Advance your Data & AI career with 50 days of live learning, contests, hands-on challenges, study groups & certifications and more!

