FabCon is coming to Atlanta
Join us at FabCon Atlanta from March 16 - 20, 2026, for the ultimate Fabric, Power BI, AI and SQL community-led event. Save $200 with code FABCOMM.
Register now!- Power BI forums
- Get Help with Power BI
- Desktop
- Service
- Report Server
- Power Query
- Mobile Apps
- Developer
- DAX Commands and Tips
- Custom Visuals Development Discussion
- Health and Life Sciences
- Power BI Spanish forums
- Translated Spanish Desktop
- Training and Consulting
- Instructor Led Training
- Dashboard in a Day for Women, by Women
- Galleries
- Data Stories Gallery
- Themes Gallery
- Contests Gallery
- Quick Measures Gallery
- Notebook Gallery
- Translytical Task Flow Gallery
- TMDL Gallery
- R Script Showcase
- Webinars and Video Gallery
- Ideas
- Custom Visuals Ideas (read-only)
- Issues
- Issues
- Events
- Upcoming Events
Calling all Data Engineers! Fabric Data Engineer (Exam DP-700) live sessions are back! Starting October 16th. Sign up.
- Power BI forums
- Forums
- Get Help with Power BI
- Desktop
- Aggregate data in a hourly interval
- Subscribe to RSS Feed
- Mark Topic as New
- Mark Topic as Read
- Float this Topic for Current User
- Bookmark
- Subscribe
- Printer Friendly Page
- Mark as New
- Bookmark
- Subscribe
- Mute
- Subscribe to RSS Feed
- Permalink
- Report Inappropriate Content
Aggregate data in a hourly interval
I have a direct query table with a creation date column.
I want to aggregate all values for one hour of certain day.
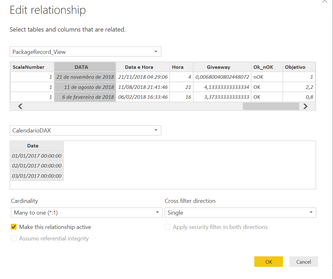
I can relate the values read in a day through the calendar with a relationships.
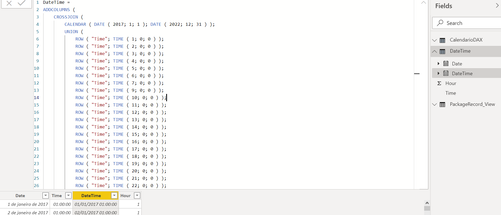
I built this type of "hourly" calendar with these relationships.
However I cannot group the data by the hour as I do daily, i dont now why.
Solved! Go to Solution.
- Mark as New
- Bookmark
- Subscribe
- Mute
- Subscribe to RSS Feed
- Permalink
- Report Inappropriate Content
Here my date table
Date =
VAR MinYear = YEAR ( MIN ( ATEs[Date] ) )
VAR MaxYear = YEAR ( MAX ( ATEs[Date] ) )
RETURN
ADDCOLUMNS (
    FILTER (
        CALENDARAUTO( );
        AND ( YEAR ( [Date] ) >= MinYear; YEAR ( [Date] ) <= MaxYear )
    );
    "Year"; YEAR ( [Date] );
    "Month Name"; FORMAT ( [Date]; "mmmm" );
    "Month Number"; MONTH ( [Date] );
    "Weekday"; FORMAT ( [Date]; "dddd" );
    "Weekday number"; WEEKDAY( [Date] );
    "Quarter"; "Q" & TRUNC ( ( MONTH ( [Date] ) - 1 ) / 3 ) + 1;
    "Day of Month"; Day([Date])
)
If I answered your question, please mark my post as solution, this will also help others.
Please give Kudos for support.
Please mark my post as solution, this will also help others.
Please give Kudos for support.
Marcus Wegener works as Full Stack Power BI Engineer at BI or DIE.
His mission is clear: "Get the most out of data, with Power BI."
twitter - LinkedIn - YouTube - website - podcast - Power BI Tutorials
- Mark as New
- Bookmark
- Subscribe
- Mute
- Subscribe to RSS Feed
- Permalink
- Report Inappropriate Content
Hi @Anonymous,
look at this.
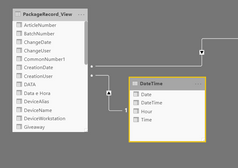
I separate date and time.
If I answered your question, please mark my post as solution, this will also help others.
Please give Kudos for support.
Please mark my post as solution, this will also help others.
Please give Kudos for support.
Marcus Wegener works as Full Stack Power BI Engineer at BI or DIE.
His mission is clear: "Get the most out of data, with Power BI."
twitter - LinkedIn - YouTube - website - podcast - Power BI Tutorials
- Mark as New
- Bookmark
- Subscribe
- Mute
- Subscribe to RSS Feed
- Permalink
- Report Inappropriate Content
That results for a table but i need to do a chart divided by month day and time on x axis... It´s possible?
Thanks
- Mark as New
- Bookmark
- Subscribe
- Mute
- Subscribe to RSS Feed
- Permalink
- Report Inappropriate Content
hi,
The problem is your relationship between the table called "package..." and "calendar". As you see the calendar is in hourly basis but your timeseries in your main table have timeseries like 15:49:00h so, it will not match with any hour in your calendar.
One solutions that you can do is to round your timeseries to up or down (your choice) in order to have a timeseries with date and time in round hours. then you can create the relationship one to many (from calendar to your main table)
Then you can create the visual chart using in the X Axis the timeseries in the calendar table and the values what you want in the Y axis. Remember that in the round of the timeseries could be possible that some timeseries could be repetead with different values of weight so.. you cna take the max, average or whatever agregation that you have
Did I answer your question? Mark my post as a solution! Appreciate with a Kudos!! (Click the Thumbs Up Button)
- Mark as New
- Bookmark
- Subscribe
- Mute
- Subscribe to RSS Feed
- Permalink
- Report Inappropriate Content
- Mark as New
- Bookmark
- Subscribe
- Mute
- Subscribe to RSS Feed
- Permalink
- Report Inappropriate Content
Hi @Anonymous ,
you mean something like this?
Please mark my post as solution, this will also help others.
Please give Kudos for support.
Marcus Wegener works as Full Stack Power BI Engineer at BI or DIE.
His mission is clear: "Get the most out of data, with Power BI."
twitter - LinkedIn - YouTube - website - podcast - Power BI Tutorials
- Mark as New
- Bookmark
- Subscribe
- Mute
- Subscribe to RSS Feed
- Permalink
- Report Inappropriate Content
- Mark as New
- Bookmark
- Subscribe
- Mute
- Subscribe to RSS Feed
- Permalink
- Report Inappropriate Content
If I answered your question, please mark my post as solution, this will also help others.
Please give Kudos for support.
Please mark my post as solution, this will also help others.
Please give Kudos for support.
Marcus Wegener works as Full Stack Power BI Engineer at BI or DIE.
His mission is clear: "Get the most out of data, with Power BI."
twitter - LinkedIn - YouTube - website - podcast - Power BI Tutorials
- Mark as New
- Bookmark
- Subscribe
- Mute
- Subscribe to RSS Feed
- Permalink
- Report Inappropriate Content
How i do to have the day of month?
- Mark as New
- Bookmark
- Subscribe
- Mute
- Subscribe to RSS Feed
- Permalink
- Report Inappropriate Content
Here my date table
Date =
VAR MinYear = YEAR ( MIN ( ATEs[Date] ) )
VAR MaxYear = YEAR ( MAX ( ATEs[Date] ) )
RETURN
ADDCOLUMNS (
    FILTER (
        CALENDARAUTO( );
        AND ( YEAR ( [Date] ) >= MinYear; YEAR ( [Date] ) <= MaxYear )
    );
    "Year"; YEAR ( [Date] );
    "Month Name"; FORMAT ( [Date]; "mmmm" );
    "Month Number"; MONTH ( [Date] );
    "Weekday"; FORMAT ( [Date]; "dddd" );
    "Weekday number"; WEEKDAY( [Date] );
    "Quarter"; "Q" & TRUNC ( ( MONTH ( [Date] ) - 1 ) / 3 ) + 1;
    "Day of Month"; Day([Date])
)
If I answered your question, please mark my post as solution, this will also help others.
Please give Kudos for support.
Please mark my post as solution, this will also help others.
Please give Kudos for support.
Marcus Wegener works as Full Stack Power BI Engineer at BI or DIE.
His mission is clear: "Get the most out of data, with Power BI."
twitter - LinkedIn - YouTube - website - podcast - Power BI Tutorials


