FabCon is coming to Atlanta
Join us at FabCon Atlanta from March 16 - 20, 2026, for the ultimate Fabric, Power BI, AI and SQL community-led event. Save $200 with code FABCOMM.
Register now!- Power BI forums
- Get Help with Power BI
- Desktop
- Service
- Report Server
- Power Query
- Mobile Apps
- Developer
- DAX Commands and Tips
- Custom Visuals Development Discussion
- Health and Life Sciences
- Power BI Spanish forums
- Translated Spanish Desktop
- Training and Consulting
- Instructor Led Training
- Dashboard in a Day for Women, by Women
- Galleries
- Data Stories Gallery
- Themes Gallery
- Contests Gallery
- Quick Measures Gallery
- Notebook Gallery
- Translytical Task Flow Gallery
- TMDL Gallery
- R Script Showcase
- Webinars and Video Gallery
- Ideas
- Custom Visuals Ideas (read-only)
- Issues
- Issues
- Events
- Upcoming Events
Join the Fabric FabCon Global Hackathon—running virtually through Nov 3. Open to all skill levels. $10,000 in prizes! Register now.
- Power BI forums
- Forums
- Get Help with Power BI
- Desktop
- Re: Aggregate a measure after Filtering
- Subscribe to RSS Feed
- Mark Topic as New
- Mark Topic as Read
- Float this Topic for Current User
- Bookmark
- Subscribe
- Printer Friendly Page
- Mark as New
- Bookmark
- Subscribe
- Mute
- Subscribe to RSS Feed
- Permalink
- Report Inappropriate Content
Aggregate a measure after Filtering
I'm very new to Power BI. I've read through many of the posts here but haven't been able to find a resolution, so hoping that someone can help.
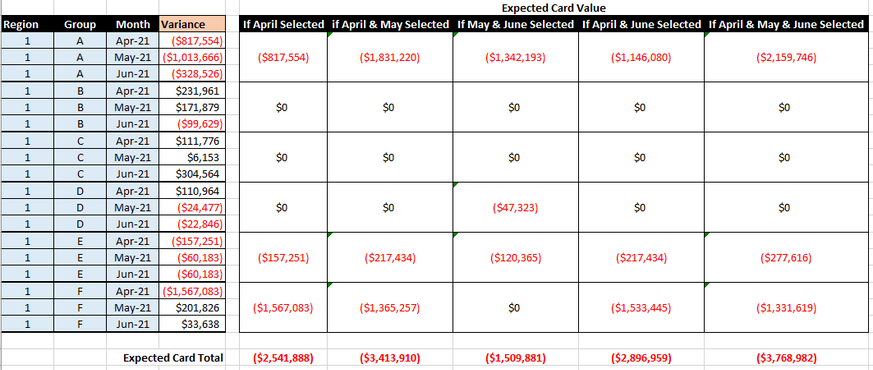
I'm trying to populate a single line Card Visual based on the selection of dates where the sum of the variance for the combination of Region, Group, and selected dates is negative, as shown below.
Any suggestions?
- Mark as New
- Bookmark
- Subscribe
- Mute
- Subscribe to RSS Feed
- Permalink
- Report Inappropriate Content
Did you try the measure I posted?
Did I answer your question? Mark my post as a solution!
In doing so, you are also helping me. Thank you!
Proud to be a Super User!
Paul on Linkedin.
- Mark as New
- Bookmark
- Subscribe
- Mute
- Subscribe to RSS Feed
- Permalink
- Report Inappropriate Content
You could try:
Expected card total =
VAR _Variance = SUM(Table[Variance])
RETURN
CALCULATE(_Variance, FILTER(Table, _Variance < 0))
Did I answer your question? Mark my post as a solution!
In doing so, you are also helping me. Thank you!
Proud to be a Super User!
Paul on Linkedin.
- Mark as New
- Bookmark
- Subscribe
- Mute
- Subscribe to RSS Feed
- Permalink
- Report Inappropriate Content
If you provide example data in copy/paste format, a specific expression can be provided. However, you can try a pattern like this to get your result.
Just Negative =
VAR summary =
ADDCOLUMNS (
SUMMARIZE ( Table, Table[Region], Table[Group], Date[YearMonth] ),
"cVariance", [YourVarianceMeasure]
)
RETURN
SUMX ( FILTER ( summary, [cVariance] < 0 ), [cVariance] )
Pat
Did I answer your question? Mark my post as a solution! Kudos are also appreciated!
To learn more about Power BI, follow me on Twitter or subscribe on YouTube.
@mahoneypa HoosierBI on YouTube
- Mark as New
- Bookmark
- Subscribe
- Mute
- Subscribe to RSS Feed
- Permalink
- Report Inappropriate Content
Pat,
This solution is very close. It works if just one month is selected. However, if multiple months are selected, the identification of a negative value for the aggregated total for the multiple months is not working properly. I've been able to get it to work if put in a table visualization with the Group included. However, once it goes into a Card visualization the calculation does not work correctly.
The desired result would be if April and May are selected in the slicer then:
For each combination of Region/Group, total the resulting value from if(sum(April Variance, May Variance)<0, sum(April Variance, May Variance),0) to create a single total number for the entire population (as shown on the last row below.
Thanks again,
- Mark as New
- Bookmark
- Subscribe
- Mute
- Subscribe to RSS Feed
- Permalink
- Report Inappropriate Content
Everytime I try to copy/paste the data and post the reply I get an HTML error. So, here's an attempt a delimited list:
Region,Group,Month,Variance
1,A,Apr-21,"($817,554)"
1,A,May-21,"($1,013,666)"
1,A,Jun-21,"($328,526)"
1,B,Apr-21,"$231,961 "
1,B,May-21,"$171,879 "
1,B,Jun-21,"($99,629)"
1,C,Apr-21,"$111,776 "
1,C,May-21,"$6,153 "
1,C,Jun-21,"$304,564 "
1,D,Apr-21,"$110,964 "
1,D,May-21,"($24,477)"
1,D,Jun-21,"($22,846)"
1,E,Apr-21,"($157,251)"
1,E,May-21,"($60,183)"
1,E,Jun-21,"($60,183)"
1,F,Apr-21,"($1,567,083)"
1,F,May-21,"$201,826 "
1,F,Jun-21,"$33,638 "
- Mark as New
- Bookmark
- Subscribe
- Mute
- Subscribe to RSS Feed
- Permalink
- Report Inappropriate Content
Hi,
Share the link from where i can download your PBI file.
Regards,
Ashish Mathur
http://www.ashishmathur.com
https://www.linkedin.com/in/excelenthusiasts/
- Mark as New
- Bookmark
- Subscribe
- Mute
- Subscribe to RSS Feed
- Permalink
- Report Inappropriate Content
- Mark as New
- Bookmark
- Subscribe
- Mute
- Subscribe to RSS Feed
- Permalink
- Report Inappropriate Content
You have selected 3 months in the slicer. How does one calculate variance for 3 months?
Regards,
Ashish Mathur
http://www.ashishmathur.com
https://www.linkedin.com/in/excelenthusiasts/
- Mark as New
- Bookmark
- Subscribe
- Mute
- Subscribe to RSS Feed
- Permalink
- Report Inappropriate Content
Still looking for a solution to this issue. Any other suggestions? Thank you!
- Mark as New
- Bookmark
- Subscribe
- Mute
- Subscribe to RSS Feed
- Permalink
- Report Inappropriate Content
Hi,
I just do not understand your question. May be someone else will help you. Sorry.
Regards,
Ashish Mathur
http://www.ashishmathur.com
https://www.linkedin.com/in/excelenthusiasts/
- Mark as New
- Bookmark
- Subscribe
- Mute
- Subscribe to RSS Feed
- Permalink
- Report Inappropriate Content
It would be the sum of the monthly variances (included in the dataset) in total, then check if it is negative or not.


