Fabric Data Days starts November 4th!
Advance your Data & AI career with 50 days of live learning, dataviz contests, hands-on challenges, study groups & certifications and more!
Get registered- Power BI forums
- Get Help with Power BI
- Desktop
- Service
- Report Server
- Power Query
- Mobile Apps
- Developer
- DAX Commands and Tips
- Custom Visuals Development Discussion
- Health and Life Sciences
- Power BI Spanish forums
- Translated Spanish Desktop
- Training and Consulting
- Instructor Led Training
- Dashboard in a Day for Women, by Women
- Galleries
- Data Stories Gallery
- Themes Gallery
- Contests Gallery
- QuickViz Gallery
- Quick Measures Gallery
- Visual Calculations Gallery
- Notebook Gallery
- Translytical Task Flow Gallery
- TMDL Gallery
- R Script Showcase
- Webinars and Video Gallery
- Ideas
- Custom Visuals Ideas (read-only)
- Issues
- Issues
- Events
- Upcoming Events
Get Fabric Certified for FREE during Fabric Data Days. Don't miss your chance! Request now
- Power BI forums
- Forums
- Get Help with Power BI
- Desktop
- Re: Adding Date Slicer using Multiple Date Columns
- Subscribe to RSS Feed
- Mark Topic as New
- Mark Topic as Read
- Float this Topic for Current User
- Bookmark
- Subscribe
- Printer Friendly Page
- Mark as New
- Bookmark
- Subscribe
- Mute
- Subscribe to RSS Feed
- Permalink
- Report Inappropriate Content
Adding Date Slicer using Multiple Date Columns
Hi All,
I'm trying to add a Date Range Slicer to my Power BI Report so every week when i'm producing 4 weeks lookahead report i just have to change dates using date range slicer. I have 5 different milestone's columns each having different dates. I have tried to add all these columns in slicer field but instead of giving me a Date Range filter its showing as a list or drop down.
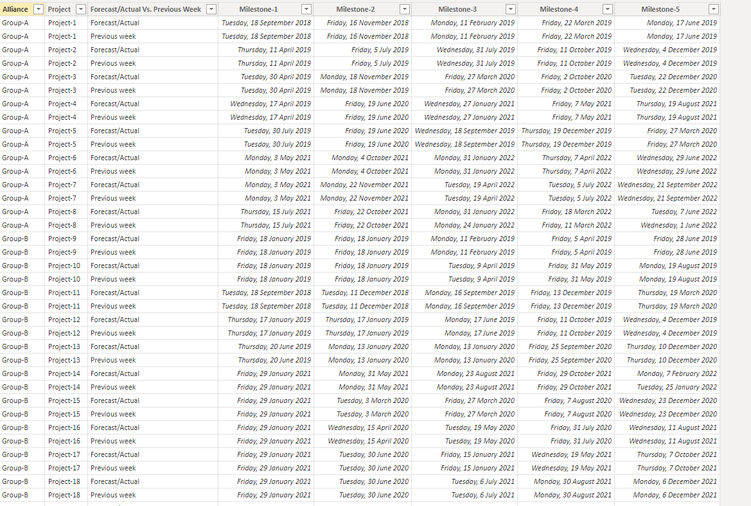
My data looks like this:
I know i can easily get Date Range slicer by unpivoting these milestone columns but don't want to do that as it will not appear correctly on my desired visual. Below is the required slicer outcome i need in my report.
I have read somewhere that it can be done by introducing a new date table and link it with all these milestone's columns but not actually sure how to do it. If anyone can help me with this issue that would be great.
link to excel data : https://docs.google.com/spreadsheets/d/1Wgk25QKH03f6j8rSMGtRh4GYjvmsm5nS/edit?usp=sharing&ouid=11141...
link to Power BI file: https://drive.google.com/file/d/1PNOHRAOY_75CyrVfbTdlKeQE7PbQP31v/view?usp=sharing
Thanks,
Ali
- Mark as New
- Bookmark
- Subscribe
- Mute
- Subscribe to RSS Feed
- Permalink
- Report Inappropriate Content
Hi Ashish,
Sorry for late reply, I was on leave and just joined work today. I'll explain below one by one:
I have this query data which i want to show on a gantt chart.
Gantt Chart will look like this:
Now on the top i want to add a date range slicer so whenever i want to select 1 Month lookahead period it will Filter all 5 milestones coming within that date range of 1 Month only.
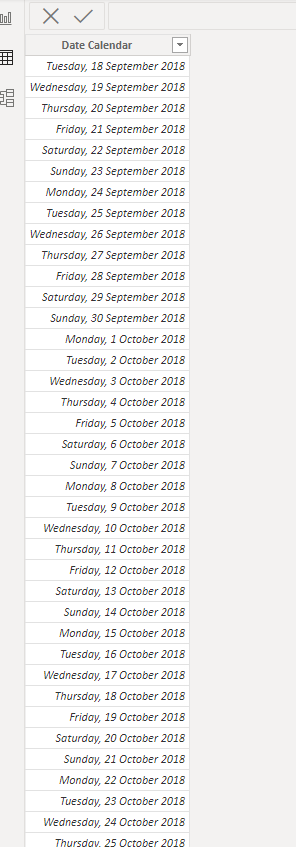
For this i have created a Calendar which i want to use in my date slicer as i cant use any of my milestones column as it will only filter out that particular milestone and will not show all other milestones coming in that date range.
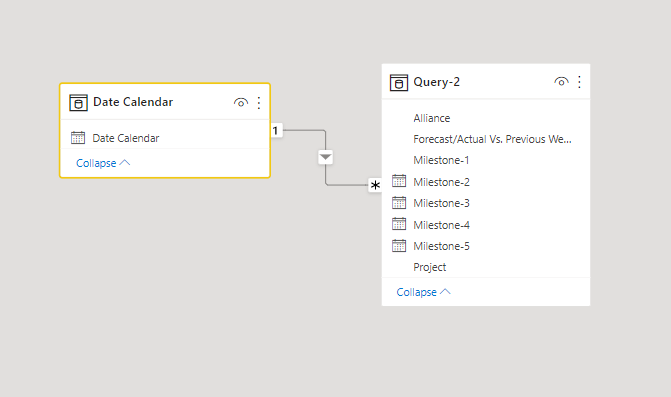
Relationships are like this at the moment and i know only one relationship can be active at a time and i don't understand how to add multiple relationships from Date Calendar Column to each of my milestone and than activate all those relationships.
I have already done unpivoting all my milestones so i can have only one date column that i could use in date slicer and it works as well but than this visual my compnay is intending to use not showing report in desired format.
These are links to files:
Please let me know if you need any further inforamtion.
Thanks,
ALI
- Mark as New
- Bookmark
- Subscribe
- Mute
- Subscribe to RSS Feed
- Permalink
- Report Inappropriate Content
@MFelix Hi Hpe you are doing well. I have seen several posts of yours regarding the same matter. Can you please help me with this?
- Mark as New
- Bookmark
- Subscribe
- Mute
- Subscribe to RSS Feed
- Permalink
- Report Inappropriate Content
Hi @aliawais ,
How are you?
Just to be clear you want to add a date slicer that filters the full Gantt chart for the specific month you select? So not showing any other months? basically trying to filter the gantt chart for the specific month.
Do you need to use this specific Gantt chart?
Regards
Miguel Félix
Did I answer your question? Mark my post as a solution!
Proud to be a Super User!
Check out my blog: Power BI em Português- Mark as New
- Bookmark
- Subscribe
- Mute
- Subscribe to RSS Feed
- Permalink
- Report Inappropriate Content
Hi @MFelix ,
Thanks for responding. Yes, you are right I want to filter whole gantt chart based on date slicer dates. (One month or any other date range selected in the Date Slicer)
Reason for using this visual as my company is looking to get this visual and want us to work on it. Plus this visual gives alot of flexibility across different fields.
P.S i have already trying using unpivoting columns method and having ONE DATE COLUMN as value is also working fine in the filter but i can not use it as having my data in un pivotted form doesn't allow me to set proper parent/child nodes and this visual has some limitations on formatting parent/child nodes.
Thanks,
Ali
- Mark as New
- Bookmark
- Subscribe
- Mute
- Subscribe to RSS Feed
- Permalink
- Report Inappropriate Content
- Mark as New
- Bookmark
- Subscribe
- Mute
- Subscribe to RSS Feed
- Permalink
- Report Inappropriate Content
Hi,
I'd request someone else to help you with this post.
Regards,
Ashish Mathur
http://www.ashishmathur.com
https://www.linkedin.com/in/excelenthusiasts/
- Mark as New
- Bookmark
- Subscribe
- Mute
- Subscribe to RSS Feed
- Permalink
- Report Inappropriate Content
Hi @aliawais
Have you solved this question with Ashish_Mathur's help? If you have solved the question, you can accept the answer helpful as the solution or share you method and accept it as solution, thanks for your contribution to improve Power BI.
If you need more help, please let me know.
Best Regards,
Community Support Team _Tang
If this post helps, please consider Accept it as the solution to help the other members find it more quickly.
- Mark as New
- Bookmark
- Subscribe
- Mute
- Subscribe to RSS Feed
- Permalink
- Report Inappropriate Content
Hi,
If you want a single date slicer, unpivoting is a compulsory step. After unpivoting, ensure that the Value column has the Data type as Date. Create a Calendar Table with a relationship (Many to One and Single) to the Value column of the Unpivoted dataset. To your slicer, drag the Date from the Calendar Table.
Regards,
Ashish Mathur
http://www.ashishmathur.com
https://www.linkedin.com/in/excelenthusiasts/
- Mark as New
- Bookmark
- Subscribe
- Mute
- Subscribe to RSS Feed
- Permalink
- Report Inappropriate Content
Hi,
Thanks for your response. You are right after unpivoting my table I'm able to use the value column as desired date range column without even creating a calendar table. But to do so I'm not able to set up my visual as per project requirements.
You mentioned that linking Calendar Table to the value table is a solution. Is there any way we can link calnedar table to all of my 5 date columns? I have read some where it's possible but i need to write a code for multiple relationships at one time as Power BI only allows one relationship active at a time.
Do you have nay idea how to do that?
Thanks Alot 🙂
- Mark as New
- Bookmark
- Subscribe
- Mute
- Subscribe to RSS Feed
- Permalink
- Report Inappropriate Content
You are welcome. You can have only 1 active relationship between 2 tables. More relationships can be built but they will have to be inactive. The USERELATIONSHIP() function can be used in DAX formulas to activate the inactive relationships. I can offer more help if you share some data, describe the question and show the expected result.
Regards,
Ashish Mathur
http://www.ashishmathur.com
https://www.linkedin.com/in/excelenthusiasts/
Helpful resources

Fabric Data Days
Advance your Data & AI career with 50 days of live learning, contests, hands-on challenges, study groups & certifications and more!

Power BI Monthly Update - October 2025
Check out the October 2025 Power BI update to learn about new features.


