cancel
Showing results for 
Search instead for 
Did you mean: 

A new Data Days event is coming soon! This time we’re going bigger than ever. Fabric, Power BI, SQL, AI and more. Don't miss out.

Reply
Anonymous
Not applicable

Add marker or reference line to dot plot

Hello, 


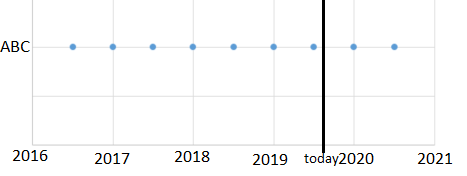
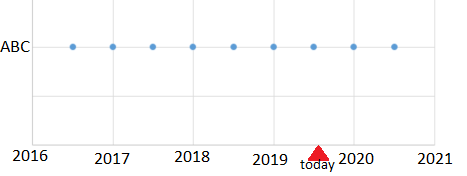
I'm using the dot plot by MAQ Software to plot dates and I'd like to add a reference line or a marker to indicate the current date. Is this possible to do in this chart type? Here are some examples to clarify. sample2.pngsample1.png

1 ACCEPTED SOLUTION
v-xicai
Community Support
Community Support

Hi @Anonymous ,


Your demand is a good idea, while it is not supported to implement vertical reference line in Power BI currently. You can post your new idea here https://ideas.powerbi.com/forums/265200-power-bi-ideas , to improve the Power BI.


It is a place for customers provide feedback about Microsoft Office products . What’s more, if a feedback is high voted there by other customers, it will be promising that Microsoft Product Team will take it into consideration when designing the next version in the future.


To work around the issue, you can try to use "line and stacked column chart" visual, and create measure Reference line like DAX below.


Reference line= IF(SELECTEDVALUE(Table1[Date])=TODAY(),MAXX (ALL(Table1[Date]), MAX(Table1[Sales] ))


9.png


Best Regards,

Amy


If this post helps, then please consider Accept it as the solution to help the other members find it more quickly.


View solution in original post

1 REPLY 1
v-xicai
Community Support
Community Support

Hi @Anonymous ,


Your demand is a good idea, while it is not supported to implement vertical reference line in Power BI currently. You can post your new idea here https://ideas.powerbi.com/forums/265200-power-bi-ideas , to improve the Power BI.


It is a place for customers provide feedback about Microsoft Office products . What’s more, if a feedback is high voted there by other customers, it will be promising that Microsoft Product Team will take it into consideration when designing the next version in the future.


To work around the issue, you can try to use "line and stacked column chart" visual, and create measure Reference line like DAX below.


Reference line= IF(SELECTEDVALUE(Table1[Date])=TODAY(),MAXX (ALL(Table1[Date]), MAX(Table1[Sales] ))


9.png


Best Regards,

Amy


If this post helps, then please consider Accept it as the solution to help the other members find it more quickly.


Helpful resources

Announcements
May Power BI Update Carousel

Power BI Monthly Update - May 2026

Check out the May 2026 Power BI update to learn about new features.

Fabric SQL PBI Data Days

Data Days 2026 coming soon!

Sign up to receive a private message when registration opens and key events begin.

New to Fabric survey Carousel

New to Fabric Survey

If you have recently started exploring Fabric, we'd love to hear how it's going. Your feedback can help with product improvements.

Power BI DataViz World Championships carousel

Power BI DataViz World Championships - June 2026

A new Power BI DataViz World Championship is coming this June! Don't miss out on submitting your entry.