Join us at FabCon Vienna from September 15-18, 2025
The ultimate Fabric, Power BI, SQL, and AI community-led learning event. Save €200 with code FABCOMM.
Get registered- Power BI forums
- Get Help with Power BI
- Desktop
- Service
- Report Server
- Power Query
- Mobile Apps
- Developer
- DAX Commands and Tips
- Custom Visuals Development Discussion
- Health and Life Sciences
- Power BI Spanish forums
- Translated Spanish Desktop
- Training and Consulting
- Instructor Led Training
- Dashboard in a Day for Women, by Women
- Galleries
- Data Stories Gallery
- Themes Gallery
- Contests Gallery
- Quick Measures Gallery
- Notebook Gallery
- Translytical Task Flow Gallery
- TMDL Gallery
- R Script Showcase
- Webinars and Video Gallery
- Ideas
- Custom Visuals Ideas (read-only)
- Issues
- Issues
- Events
- Upcoming Events
Enhance your career with this limited time 50% discount on Fabric and Power BI exams. Ends September 15. Request your voucher.
- Power BI forums
- Forums
- Get Help with Power BI
- Desktop
- Add a measure at the end of a matrix
- Subscribe to RSS Feed
- Mark Topic as New
- Mark Topic as Read
- Float this Topic for Current User
- Bookmark
- Subscribe
- Printer Friendly Page
- Mark as New
- Bookmark
- Subscribe
- Mute
- Subscribe to RSS Feed
- Permalink
- Report Inappropriate Content
Add a measure at the end of a matrix
Hi Everyone,
My case is that I have a matrix and would like to add a measure at the end of it. Currently, when I add that measure the matrix looks like this:
| Answers | Yes | No | ||||
| Questions | # | % | New Measure | # | % | New Measure |
| 1. Did the advisor open the call appropriately? | 1436 | 95% | 73 | 5% | ||
| 2. Did the Advisor identify/discover the situation of the Customer? | 278 | 18% | 27 | 2% | ||
| 3. Did the Advisor explain/provide proper Solutions & Education based on the circumstances? | 1288 | 85% | 207 | 14% | ||
| 4. Did the Advisor properly close the call? | 157 | 10% | 5 | 0% | ||
| 5. Did the Advisor relate to the Customer and/or bridge if necessary? | 200 | 15% | 10 | 0% |
But I need the matrix to look like this:
| Answers | Yes | No | |||
| Questions | # | % | # | % | New Measure |
| 1. Did the advisor open the call appropriately? | 1436 | 95% | 73 | 5% | |
| 2. Did the Advisor identify/discover the situation of the Customer? | 278 | 18% | 27 | 2% | |
| 3. Did the Advisor explain/provide proper Solutions & Education based on the circumstances? | 1288 | 85% | 207 | 14% | |
| 4. Did the Advisor properly close the call? | 157 | 10% | 5 | 0% | |
| 5. Did the Advisor relate to the Customer and/or bridge if necessary? |
I've been reading possible solutions and I found something related to custom hierarchies, I don't know if that's the solution, but I'm trying to implement it with no success. Is this doable in Power BI?
- Mark as New
- Bookmark
- Subscribe
- Mute
- Subscribe to RSS Feed
- Permalink
- Report Inappropriate Content
Hi @jonatan_ap ,
I created some data:
This is by design of Power BI, Meausre will act on Column on each matrix.
You can consider creating a new table by adding columns to it.
In [Group], there are "Yes" and "No", we can put all the values of Measure into "Yes" by IF judgment, and then Set an impossible value (say 99999) into "No", and finally delete this non-existent part.
Here are the steps you can follow:
1. Create measure.
Table 2 =
var _table1=
SUMMARIZE(
    'Table',
    'Table'[Qusetions],'Table'[Group],
    "Group2","Measure",
    "Value",
    IF(
        'Table'[Group]="Yes",1,99999))
var _table2=
UNION(
    'Table',_table1)
return
FILTER(
    _table2,[Value]<>99999)
2. Result:
Best Regards,
Liu Yang
If this post helps, then please consider Accept it as the solution to help the other members find it more quickly
- Mark as New
- Bookmark
- Subscribe
- Mute
- Subscribe to RSS Feed
- Permalink
- Report Inappropriate Content
Hi,
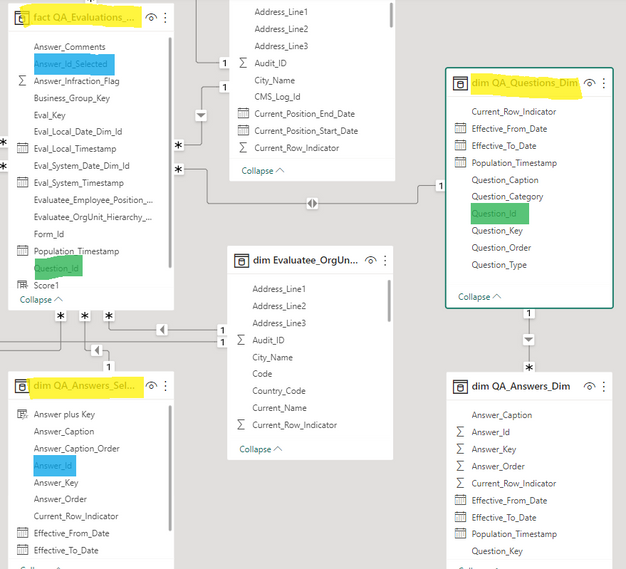
I appreciate your help, I understand your example, you're using one table to create the measure and the value. In my case, your Table becomes 3 different tables in my design. I have the table Questions, the table Answers, and the table Evaluations that is one containing the # column in my matrix. The % column is just the same # column but I changed the "Show Value as" to Percent of row total.
Like this:
Yellow: Tables in use.
Green: The key from the Question table and Evaluations table
Blue: The key from the Answers table to Evaluations table
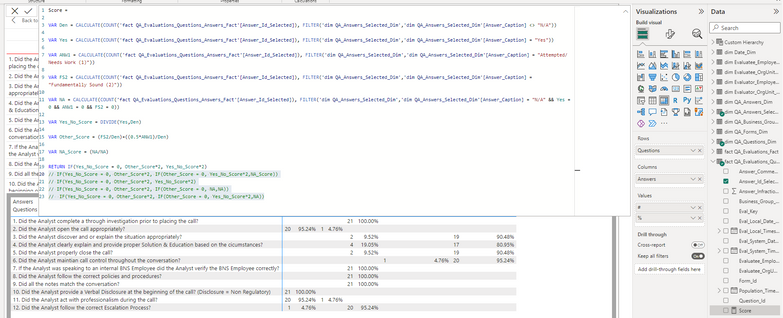
and my Matrix is something like this:
How can I jump from these 3 tables to do what you're explaining?
And the measure I want to add I created in the Evaluation table, like this:
Thanks again for your help, I really appreciate it.
Helpful resources
| User | Count |
|---|---|
| 69 | |
| 64 | |
| 62 | |
| 55 | |
| 28 |
| User | Count |
|---|---|
| 203 | |
| 82 | |
| 65 | |
| 48 | |
| 38 |


