FabCon is coming to Atlanta
Join us at FabCon Atlanta from March 16 - 20, 2026, for the ultimate Fabric, Power BI, AI and SQL community-led event. Save $200 with code FABCOMM.
Register now!- Power BI forums
- Get Help with Power BI
- Desktop
- Service
- Report Server
- Power Query
- Mobile Apps
- Developer
- DAX Commands and Tips
- Custom Visuals Development Discussion
- Health and Life Sciences
- Power BI Spanish forums
- Translated Spanish Desktop
- Training and Consulting
- Instructor Led Training
- Dashboard in a Day for Women, by Women
- Galleries
- Data Stories Gallery
- Themes Gallery
- Contests Gallery
- QuickViz Gallery
- Quick Measures Gallery
- Visual Calculations Gallery
- Notebook Gallery
- Translytical Task Flow Gallery
- TMDL Gallery
- R Script Showcase
- Webinars and Video Gallery
- Ideas
- Custom Visuals Ideas (read-only)
- Issues
- Issues
- Events
- Upcoming Events
Get Fabric Certified for FREE during Fabric Data Days. Don't miss your chance! Request now
- Power BI forums
- Forums
- Get Help with Power BI
- Desktop
- Accumulated by dates
- Subscribe to RSS Feed
- Mark Topic as New
- Mark Topic as Read
- Float this Topic for Current User
- Bookmark
- Subscribe
- Printer Friendly Page
- Mark as New
- Bookmark
- Subscribe
- Mute
- Subscribe to RSS Feed
- Permalink
- Report Inappropriate Content
Accumulated by dates
Hello community, I hope you can help me with this question
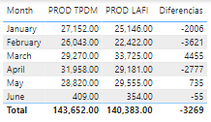
I am trying to look for the accumulated of our stock, without emabargo to program in DAX I am not the best, I could only do this Measure that takes the difference between the inputs and the processed:
PROD TPDM= Inputs
LAFI INPUT = Outputs

However I want you to show the accumulated, that is:
| Month | in | out | Difference* | stock |
| January | 27,152 | 25,146 | 2,006 | 2,006 |
| February | 26,043 | 22,422 | 3,621 | 5,627 |
| March | 29,270 | 33,725 | -4,455 | 1,172 |
| April | 31,958 | 29,181 | 2,777 | 3,949 |
| May | 28,820 | 29,555 | -735 | 3,214 |
| June | 409 | 354 | 55 | 3,269 |
| … | … | … | … |
*The Difference column I don't want to appear
I hope you can help me
- Mark as New
- Bookmark
- Subscribe
- Mute
- Subscribe to RSS Feed
- Permalink
- Report Inappropriate Content
Hello @Syndicate_Admin,
I believe that you are talking about cumulative sum. Here's how you can do it with DAX:
CUM_DIFF =
CALCULATE (
SUM('TABLE'[Diferencias]),
FILTER(ALL('TABLE'),
'TABLE'[MONTH NUM] <= EARLIER ( 'TABLE'[MONTH NUM] )
)
)

Here are the link that you might find helpful: Solved: Cumulative Sum, DAX - Microsoft Power BI Community
Hope this help!
Best,
JKC
- Mark as New
- Bookmark
- Subscribe
- Mute
- Subscribe to RSS Feed
- Permalink
- Report Inappropriate Content
It is just what I want to do, without emabargo, my data is not separated by months, the data is individual data and is grouped depending on the month, as seen in the photo, try to make a column with the number of the month, but I do not know if it works that way
And this columa I made with a Month
It is also worth mentioning that the production and the entries are in two separate tables
- Mark as New
- Bookmark
- Subscribe
- Mute
- Subscribe to RSS Feed
- Permalink
- Report Inappropriate Content
Yes, it can be done. You just need to make sure that you have define the right schema relationships for working with both LAFI & TPDM tables. A simple illustration of this schema is presented as below.
The results presented from the simple tables in Power BI is shown as below.
The DAX formula uses are the same without much complications, thus, you should be able to handle easily.
Best,
JKC
---
FYI: LAFI table has 141 rows & TPDM table has 145 rows.
- Mark as New
- Bookmark
- Subscribe
- Mute
- Subscribe to RSS Feed
- Permalink
- Report Inappropriate Content
@Syndicate_Admin , I think you need something like this
Inventory / OnHand
[Intial Inventory] + CALCULATE(SUM(Table[Ordered]),filter(date,date[date] <=maxx(date,date[date]))) - CALCULATE(SUM(Table[Sold]),filter(date,date[date] <=maxx(date,date[date])))
Inventory / OnHand =
CALCULATE(SUM(Table[Ordered]),filter(date,date[date] <=maxx(date,date[date]))) - CALCULATE(SUM(Table[Sold]),filter(date,date[date] <=maxx(date,date[date])))
How to work with more than one date
Helpful resources

Power BI Monthly Update - November 2025
Check out the November 2025 Power BI update to learn about new features.

Fabric Data Days
Advance your Data & AI career with 50 days of live learning, contests, hands-on challenges, study groups & certifications and more!


