Huge last-minute discounts for FabCon Vienna from September 15-18, 2025
Supplies are limited. Contact info@espc.tech right away to save your spot before the conference sells out.
Get your discount- Power BI forums
- Get Help with Power BI
- Desktop
- Service
- Report Server
- Power Query
- Mobile Apps
- Developer
- DAX Commands and Tips
- Custom Visuals Development Discussion
- Health and Life Sciences
- Power BI Spanish forums
- Translated Spanish Desktop
- Training and Consulting
- Instructor Led Training
- Dashboard in a Day for Women, by Women
- Galleries
- Data Stories Gallery
- Themes Gallery
- Contests Gallery
- Quick Measures Gallery
- Notebook Gallery
- Translytical Task Flow Gallery
- TMDL Gallery
- R Script Showcase
- Webinars and Video Gallery
- Ideas
- Custom Visuals Ideas (read-only)
- Issues
- Issues
- Events
- Upcoming Events
Score big with last-minute savings on the final tickets to FabCon Vienna. Secure your discount
- Power BI forums
- Forums
- Get Help with Power BI
- Desktop
- 12-month rolling calculation with another moving d...
- Subscribe to RSS Feed
- Mark Topic as New
- Mark Topic as Read
- Float this Topic for Current User
- Bookmark
- Subscribe
- Printer Friendly Page
- Mark as New
- Bookmark
- Subscribe
- Mute
- Subscribe to RSS Feed
- Permalink
- Report Inappropriate Content
12-month rolling calculation with another moving date variable (Second Attempt - More Description)
Hi Folks,
Using September 2021 RS desktop.
I'm trying to build a measure for 12-month rolling costs, which seemed to work out.
CostR12 =
Var SelectedMaxDate = MAX ('Claims Costs Transactions'[DatePaidOrAuthorized])
Var MinDate =
        CALCULATE (
            MIN ( 'Date'[Date] ),
            FILTER (
                  ALL ( 'Date' ),
                  DATEADD (
                        'Date'[Date],
                        1,
                         YEAR
                  ) > SelectedMaxDate
            )
      )
Return
CALCULATE (
      SUM ( 'Claims Costs Transactions'[Amount] ),
      ALL ( 'Date' ),
      'Date'[Date] <= SelectedMaxDate,
      'Date'[Date] >= MinDate
)
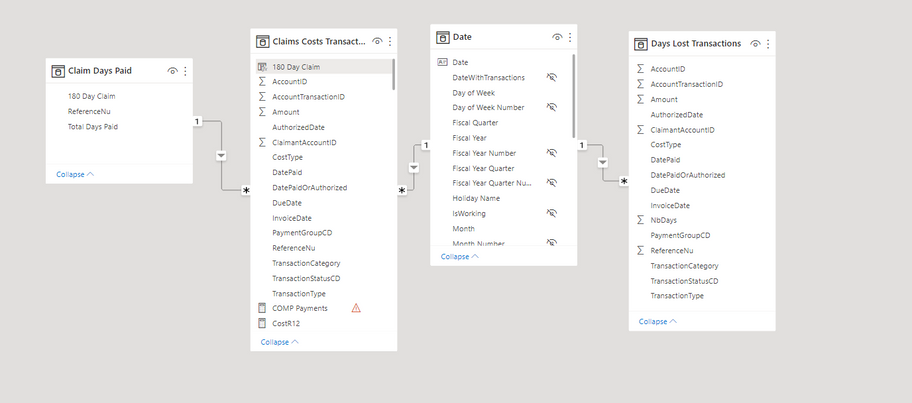
However, I also required the measure to be categorized by another measure which also has a date variable. IF the sum of a field in another table is >=180, the costs should be labeled "Yes". I built a table measure to determine if a 'ReferenceNu' has accumulated enough NbDays by the end of a period.
Claim Days Paid =
Var SelectedMaxDateDaysPaid = MAX ('Date'[Date])
Return
CALCULATETABLE(
    SUMMARIZE(
        'Days Lost Transactions',
        'Days Lost Transactions'[ReferenceNu],
        "Total Days Paid", SUM('Days Lost Transactions'[NbDays]),
        "180 Day Claim", IF(SUM('Days Lost Transactions'[NbDays])>=180,"Yes","No")
    ),
    FILTER(
        'Days Lost Transactions',
        'Days Lost Transactions'[DatePaidOrAuthorized] <= SelectedMaxDateDaysPaid
    ),
    FILTER(
    'Days Lost Transactions',
    'Days Lost Transactions'[PaymentGroupCD] = "COMP"
))
It isn't working though, and applies the latest result for all periods. For example, for the referencenumber in the image above we should be seeing the result in the table below. As that reference number hasn't acumulated 180 days until Q2 2022.
| Year Quarter | ReferenceNu | 180 Day Claim |
| Q4 2021 | 20212866 | No |
| Q1 2022 | 20212866 | No |
| Q2 2022 | 20212866 | Yes |
Here is my model:
What's the best approach?
Thanks for taking the time to read through this.
- Mark as New
- Bookmark
- Subscribe
- Mute
- Subscribe to RSS Feed
- Permalink
- Report Inappropriate Content
Hi,
Share the link from where i can download your PBI file and show the expected result very clearly.
Regards,
Ashish Mathur
http://www.ashishmathur.com
https://www.linkedin.com/in/excelenthusiasts/
- Mark as New
- Bookmark
- Subscribe
- Mute
- Subscribe to RSS Feed
- Permalink
- Report Inappropriate Content
Hi Ashish,
Here's a link for the .pbix file I'm working with.
https://drive.google.com/file/d/1pJ-66sbkMXtZs6eM_3-xpHhcrqRrnyqJ/view?usp=sharing
- Mark as New
- Bookmark
- Subscribe
- Mute
- Subscribe to RSS Feed
- Permalink
- Report Inappropriate Content
Your CostR12 measure can be simplified (even though that may be giving you the correct answer). Please explain what you want to calculate via that measure. Then we will go to answering your actual question asked.
Regards,
Ashish Mathur
http://www.ashishmathur.com
https://www.linkedin.com/in/excelenthusiasts/
- Mark as New
- Bookmark
- Subscribe
- Mute
- Subscribe to RSS Feed
- Permalink
- Report Inappropriate Content
Every quarter I need to know see my 12-month rolling costs, which I've done with my COSTR12.
All of the costs in the 'Claims Costs Transactions' table are associated with claims using the [ClaimantAccountID] or [ReferenceNu] fields, and some of those claims have a sum of [NbDays]>=180 in the 'Days Lost Transactions' table.
For each of those quarters, I want to be able to visually split the total 12-month rolling cost into cost for 180+ day claims and <180 day claims. The measure needs to sum up the [NbDays] field in the 'Days Paid Transactions' for each [ReferenceNu] IF the [DatePaidorAuthorized] is before the end of the quarter being reported on. So as we move back in time in that line graph, some of those claims have no longer reached that 180 days yet, which in turn moves those costs into the <180 day claim category.
- Mark as New
- Bookmark
- Subscribe
- Mute
- Subscribe to RSS Feed
- Permalink
- Report Inappropriate Content
I referred to "The image above", but it didn't load. Here is the example I'm getting from the current measure.


