FabCon is coming to Atlanta
Join us at FabCon Atlanta from March 16 - 20, 2026, for the ultimate Fabric, Power BI, AI and SQL community-led event. Save $200 with code FABCOMM.
Register now!- Power BI forums
- Get Help with Power BI
- Desktop
- Service
- Report Server
- Power Query
- Mobile Apps
- Developer
- DAX Commands and Tips
- Custom Visuals Development Discussion
- Health and Life Sciences
- Power BI Spanish forums
- Translated Spanish Desktop
- Training and Consulting
- Instructor Led Training
- Dashboard in a Day for Women, by Women
- Galleries
- Data Stories Gallery
- Themes Gallery
- Contests Gallery
- QuickViz Gallery
- Quick Measures Gallery
- Visual Calculations Gallery
- Notebook Gallery
- Translytical Task Flow Gallery
- TMDL Gallery
- R Script Showcase
- Webinars and Video Gallery
- Ideas
- Custom Visuals Ideas (read-only)
- Issues
- Issues
- Events
- Upcoming Events
The Power BI Data Visualization World Championships is back! Get ahead of the game and start preparing now! Learn more
- Power BI forums
- Galleries
- Data Stories Gallery
- Visualizing Merge Join Types in Power BI
Your file has been submitted successfully. We’re processing it now - please check back in a few minutes to view your report.


- Mark as New
- Bookmark
- Subscribe
- Mute
- Subscribe to RSS Feed
- Permalink
- Report Inappropriate Content
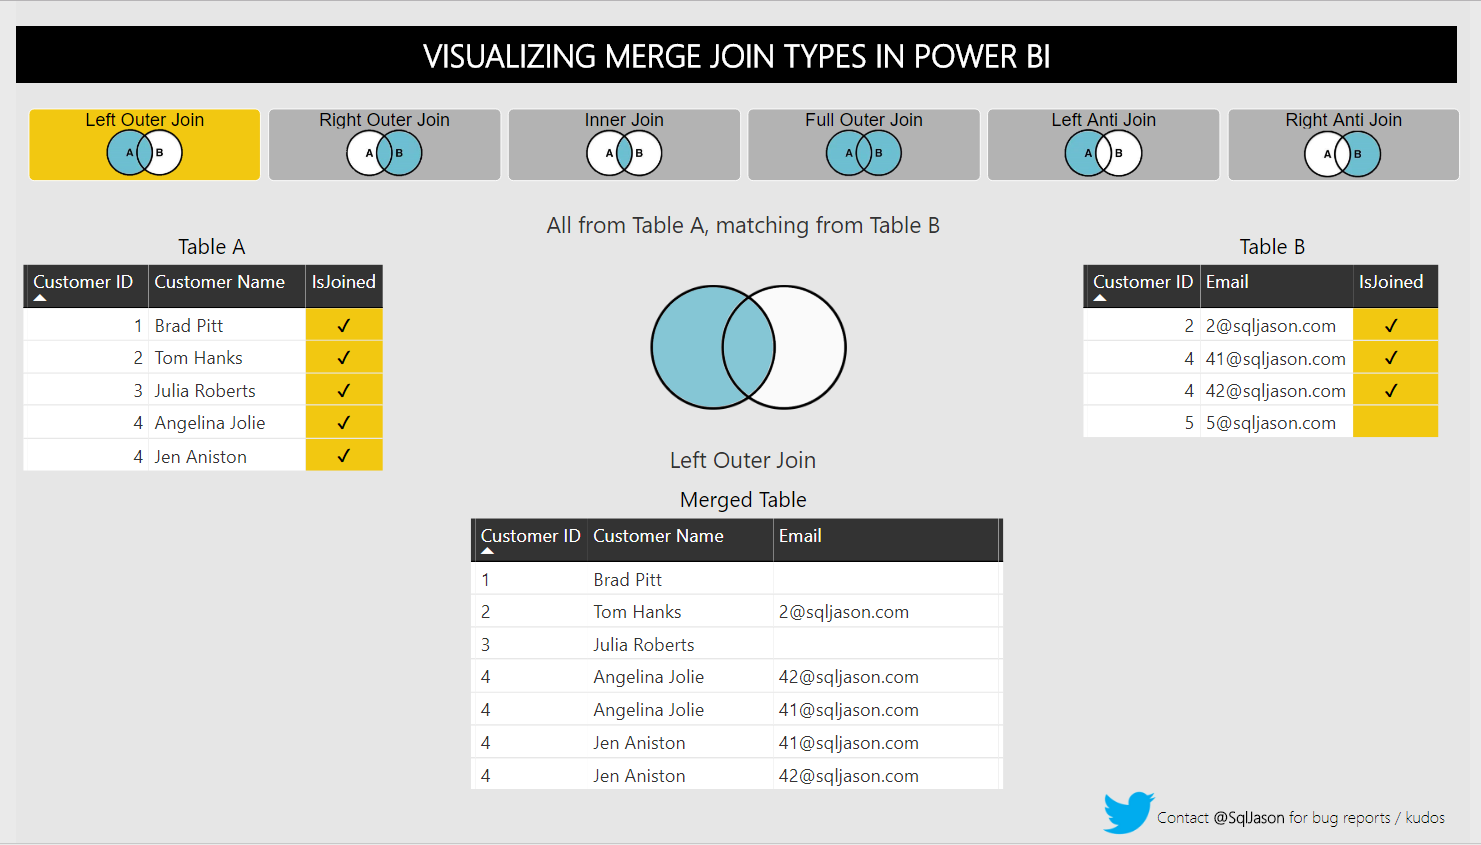
Visualizing Merge Join Types in Power BI
You can combine two queries in Power BI using the Merge Queries option (in Edit Queries). While merging queries, you will be asked for a join kind. This report visually shows what are the different join kinds as well as show the resulting merged table.
eyJrIjoiYmNhNzgzYjAtNjc2OS00YjQwLTgwNzItM2Q1MzcyMmJlYjMyIiwidCI6IjZjMGE1YjljLTA4OWEtNDk0ZS1iMDVlLTcxNjEwOTgyOTA0NyIsImMiOjF9
- Mark as New
- Bookmark
- Subscribe
- Mute
- Subscribe to RSS Feed
- Permalink
- Report Inappropriate Content
Hi @SqlJason,
I really liked your report on “Visualizing Merge Join Types in Power BI”.
Could you please share the .pbix file with me?
Thank you in advance!
- Mark as New
- Bookmark
- Subscribe
- Mute
- Subscribe to RSS Feed
- Permalink
- Report Inappropriate Content
Hi @SqlJason,
I really liked your report on “Visualizing Merge Join Types in Power BI”.
Could you please share the .pbix file with me?
Thank you in advance!
- Mark as New
- Bookmark
- Subscribe
- Mute
- Subscribe to RSS Feed
- Permalink
- Report Inappropriate Content
Thank you for your effort, very helpful.
- Mark as New
- Bookmark
- Subscribe
- Mute
- Subscribe to RSS Feed
- Permalink
- Report Inappropriate Content
Hi Jason,
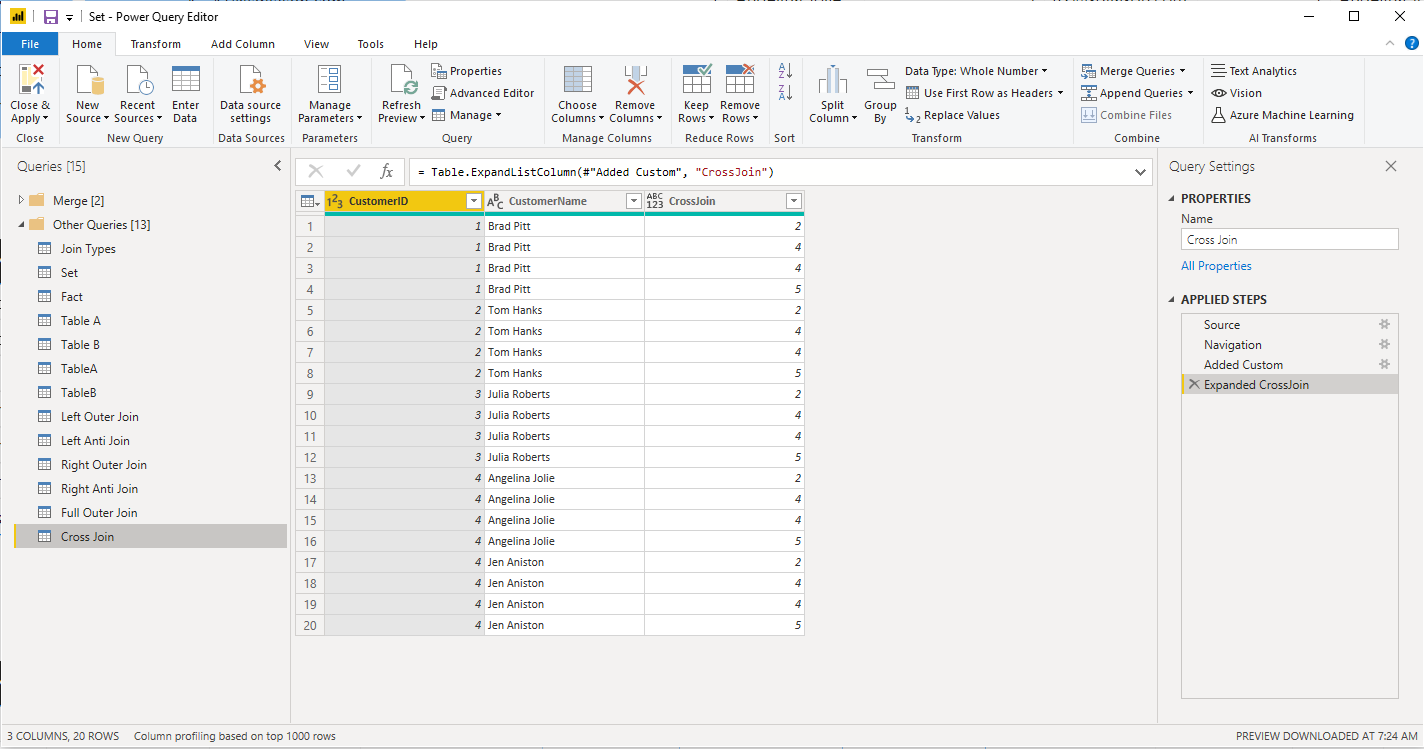
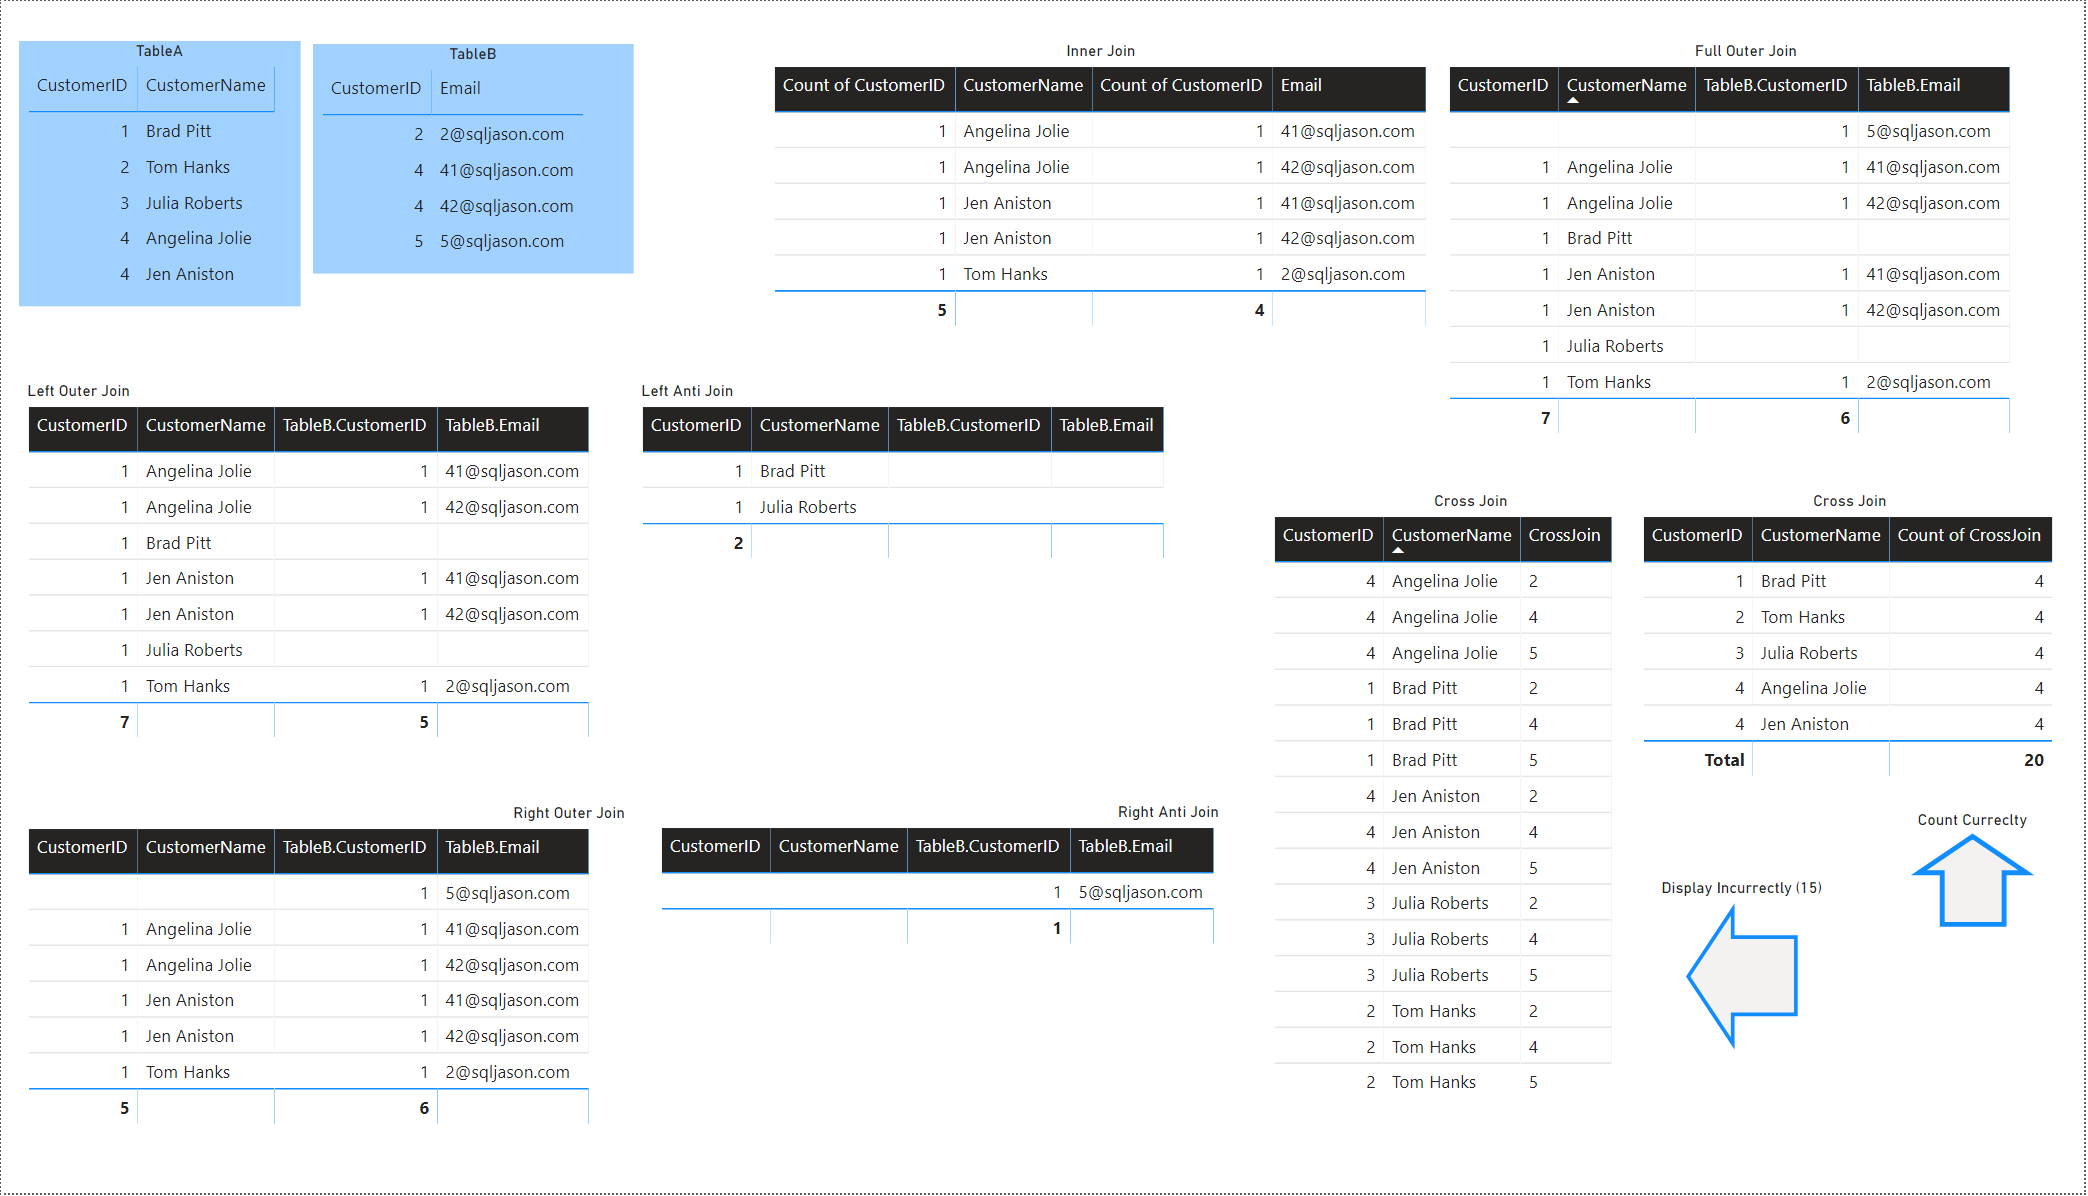
I expanded on your sample and I notice that when you do Cross Join it show correct value in power query (5x4=20)
But when you try to show in power bi table visual you get only 15 records (5x3) ?
How do you correct that? see attachments
Thanks,
Oded Dror
- Mark as New
- Bookmark
- Subscribe
- Mute
- Subscribe to RSS Feed
- Permalink
- Report Inappropriate Content
Jason,
Please Discard the previous question I fix it
Thanks,
Oded Dror
- Mark as New
- Bookmark
- Subscribe
- Mute
- Subscribe to RSS Feed
- Permalink
- Report Inappropriate Content
Good Job!
- Mark as New
- Bookmark
- Subscribe
- Mute
- Subscribe to RSS Feed
- Permalink
- Report Inappropriate Content
- Mark as New
- Bookmark
- Subscribe
- Mute
- Subscribe to RSS Feed
- Permalink
- Report Inappropriate Content
Are you using the Visio custom visual for the main join diagram?
- Mark as New
- Bookmark
- Subscribe
- Mute
- Subscribe to RSS Feed
- Permalink
- Report Inappropriate Content
Synoptic Panel. Just made a simple png using PowerPoint and then used the Synoptic Designer to create the 3 areas within the Venn chart.
I initially thought of using the Visio custom visual, but then remembered that you will need to make the visio file public with everyone to publish this report to the web. This visual requires One Drive for Business (so I don't have a personal account) and right now, my company does not allow sharing files publicly. So could not use the Visio option.
- Mark as New
- Bookmark
- Subscribe
- Mute
- Subscribe to RSS Feed
- Permalink
- Report Inappropriate Content
Hi @SqlJason,
I really liked your report on “Visualizing Merge Join Types in Power BI”.
Could you please share the .pbix file with me? Thank you in advance!
- Mark as New
- Bookmark
- Subscribe
- Mute
- Subscribe to RSS Feed
- Permalink
- Report Inappropriate Content
Hi @SqlJason,
I really liked your report on “Visualizing Merge Join Types in Power BI”.
Could you please share the .pbix file with me? Thank you in advance!
- Mark as New
- Bookmark
- Subscribe
- Mute
- Subscribe to RSS Feed
- Permalink
- Report Inappropriate Content
Thanks. I see Synoptic's zoom control now. I haven't spent any time with the Visio preview.
- Mark as New
- Bookmark
- Subscribe
- Mute
- Subscribe to RSS Feed
- Permalink
- Report Inappropriate Content
Nice work Jason (and great idea too)!
I haven't seen anything explaining joins as simple to understand as your diagram on page 2. As much as the Venn diagram is a classic, the blocks were as straightforward as side-ways Tetris to me (seeing which blocks "fall" to the right-hand column based on their presence and/or absence in the other 2 columns).
Cross joins might be worth adding to the mix (but that would not be fun to do).
In Wisconsin? Join the Madison Power BI User Group.
- Mark as New
- Bookmark
- Subscribe
- Mute
- Subscribe to RSS Feed
- Permalink
- Report Inappropriate Content
Thanks Leonard, though I can only take the credit for developing the actual solution. The join diagrams are inspired from this post - https://blog.jooq.org/2016/07/05/say-no-to-venn-diagrams-when-explaining-joins/ and was pointed out to me on twitter by @@thesqlgrrrl.