Join us at FabCon Vienna from September 15-18, 2025
The ultimate Fabric, Power BI, SQL, and AI community-led learning event. Save €200 with code FABCOMM.
Get registered- Power BI forums
- Get Help with Power BI
- Desktop
- Service
- Report Server
- Power Query
- Mobile Apps
- Developer
- DAX Commands and Tips
- Custom Visuals Development Discussion
- Health and Life Sciences
- Power BI Spanish forums
- Translated Spanish Desktop
- Training and Consulting
- Instructor Led Training
- Dashboard in a Day for Women, by Women
- Galleries
- Data Stories Gallery
- Themes Gallery
- Contests Gallery
- Quick Measures Gallery
- Notebook Gallery
- Translytical Task Flow Gallery
- TMDL Gallery
- R Script Showcase
- Webinars and Video Gallery
- Ideas
- Custom Visuals Ideas (read-only)
- Issues
- Issues
- Events
- Upcoming Events
Enhance your career with this limited time 50% discount on Fabric and Power BI exams. Ends August 31st. Request your voucher.
- Power BI forums
- Galleries
- Data Stories Gallery
- Re: Scottish Football:- Results, Stats and Matchup...
Re: Scottish Football:- Results, Stats and Matchups in the SPFL since 2000
09-28-2016 02:04 AM


- Mark as New
- Bookmark
- Subscribe
- Mute
- Subscribe to RSS Feed
- Permalink
- Report Inappropriate Content
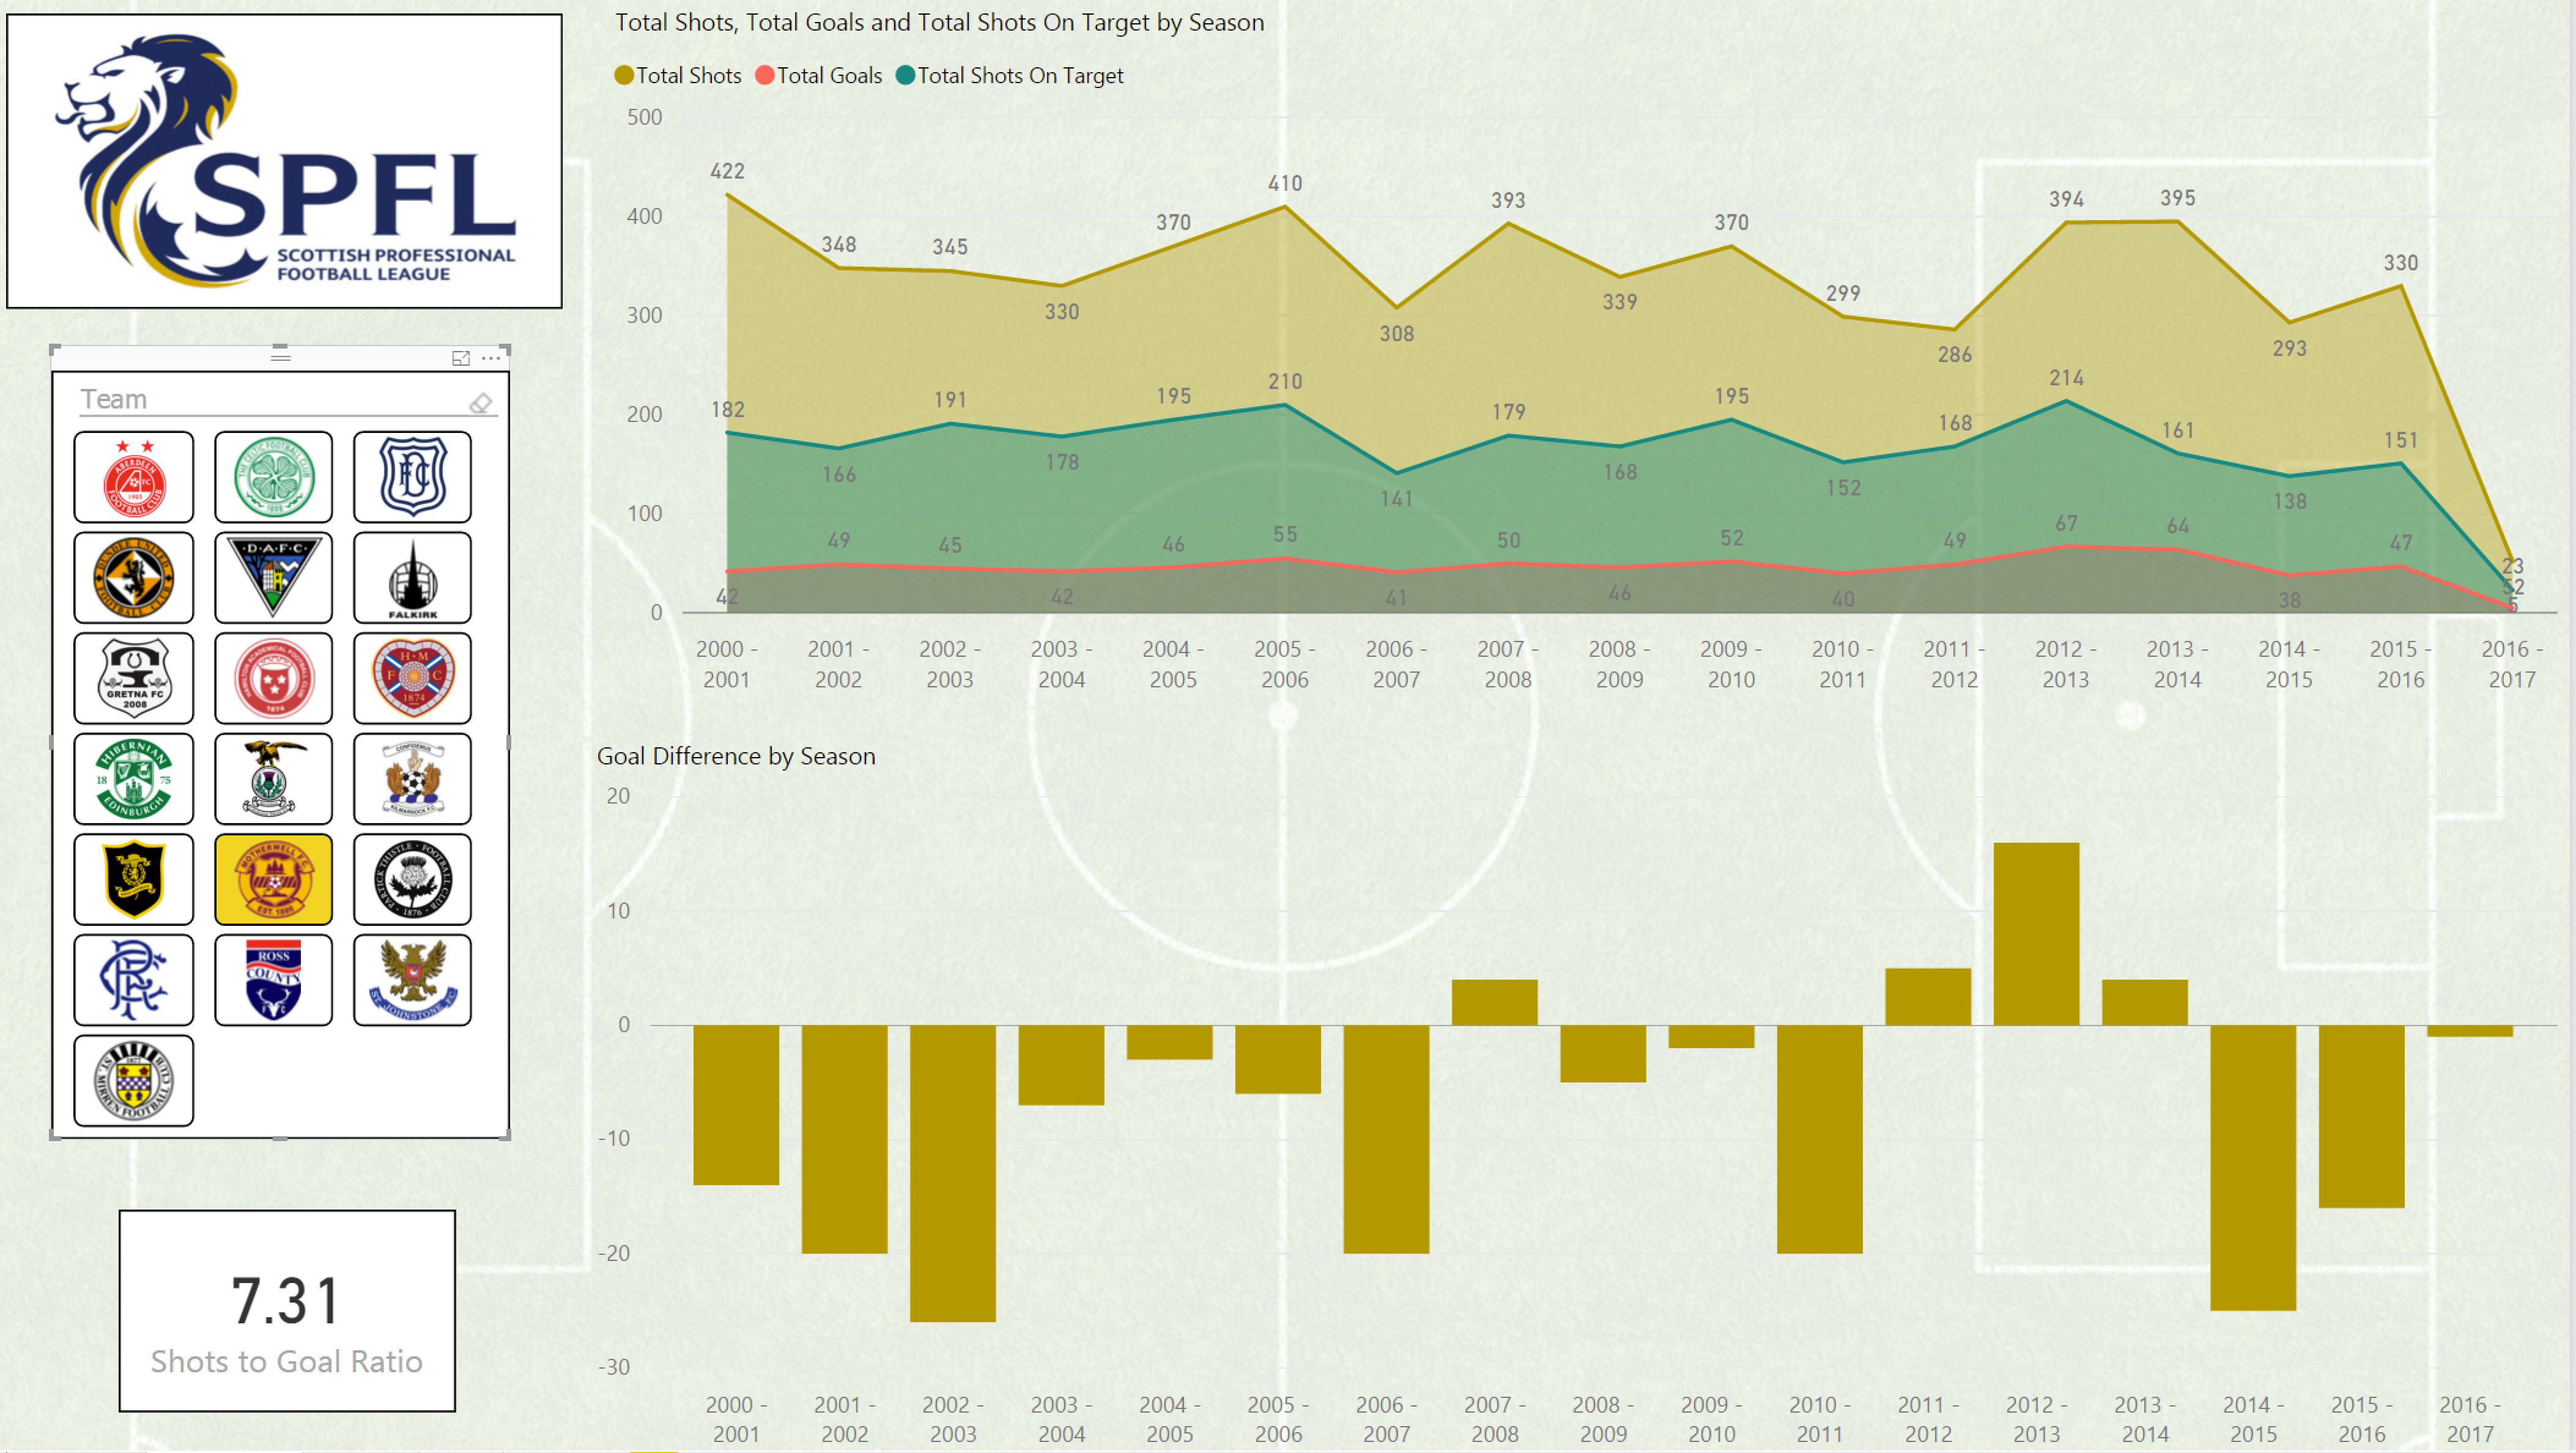
Scottish Football:- Results, Stats and Matchups in the SPFL since 2000
An interactactive Power BI report I've been working on and constantly updating. This has all SPL/SPFL results from 2000 till now, and various visualisations can be filtered by season or team. Statistics such as points, goal difference, shots, shots on target and average points per season are shown, as well as matchup page where two teams can be compared against each other.
The data from this has been sourced primarily from football-data.co.uk, Wikipedia and http://spfl.co.uk/.
eyJrIjoiOTI1N2MyNjUtZTQ0MC00YjM2LThkOGYtN2FlMTY0OWJkOTllIiwidCI6ImRkZTlkYzcxLTJhMmEtNGRmYS1iMTE0LTc5MmZiNzJlYTBlMiIsImMiOjh9
- Mark as New
- Bookmark
- Subscribe
- Mute
- Subscribe to RSS Feed
- Permalink
- Report Inappropriate Content
Anybody else not able to view this?
- Mark as New
- Bookmark
- Subscribe
- Mute
- Subscribe to RSS Feed
- Permalink
- Report Inappropriate Content
Yeah, apologies, it wasn't working for me either. I've republished the post and it looks like it's working now.
- Mark as New
- Bookmark
- Subscribe
- Mute
- Subscribe to RSS Feed
- Permalink
- Report Inappropriate Content
Cheers, nice dashboard