FabCon is coming to Atlanta
Join us at FabCon Atlanta from March 16 - 20, 2026, for the ultimate Fabric, Power BI, AI and SQL community-led event. Save $200 with code FABCOMM.
Register now!- Power BI forums
- Get Help with Power BI
- Desktop
- Service
- Report Server
- Power Query
- Mobile Apps
- Developer
- DAX Commands and Tips
- Custom Visuals Development Discussion
- Health and Life Sciences
- Power BI Spanish forums
- Translated Spanish Desktop
- Training and Consulting
- Instructor Led Training
- Dashboard in a Day for Women, by Women
- Galleries
- Data Stories Gallery
- Themes Gallery
- Contests Gallery
- Quick Measures Gallery
- Notebook Gallery
- Translytical Task Flow Gallery
- TMDL Gallery
- R Script Showcase
- Webinars and Video Gallery
- Ideas
- Custom Visuals Ideas (read-only)
- Issues
- Issues
- Events
- Upcoming Events
To celebrate FabCon Vienna, we are offering 50% off select exams. Ends October 3rd. Request your discount now.
- Power BI forums
- Galleries
- Data Stories Gallery
- Re: Profitability with What-if in hierarchy horizo...
Re: Profitability with What-if in hierarchy horizontal chart
08-19-2017 20:58 PM


- Mark as New
- Bookmark
- Subscribe
- Mute
- Subscribe to RSS Feed
- Permalink
- Report Inappropriate Content
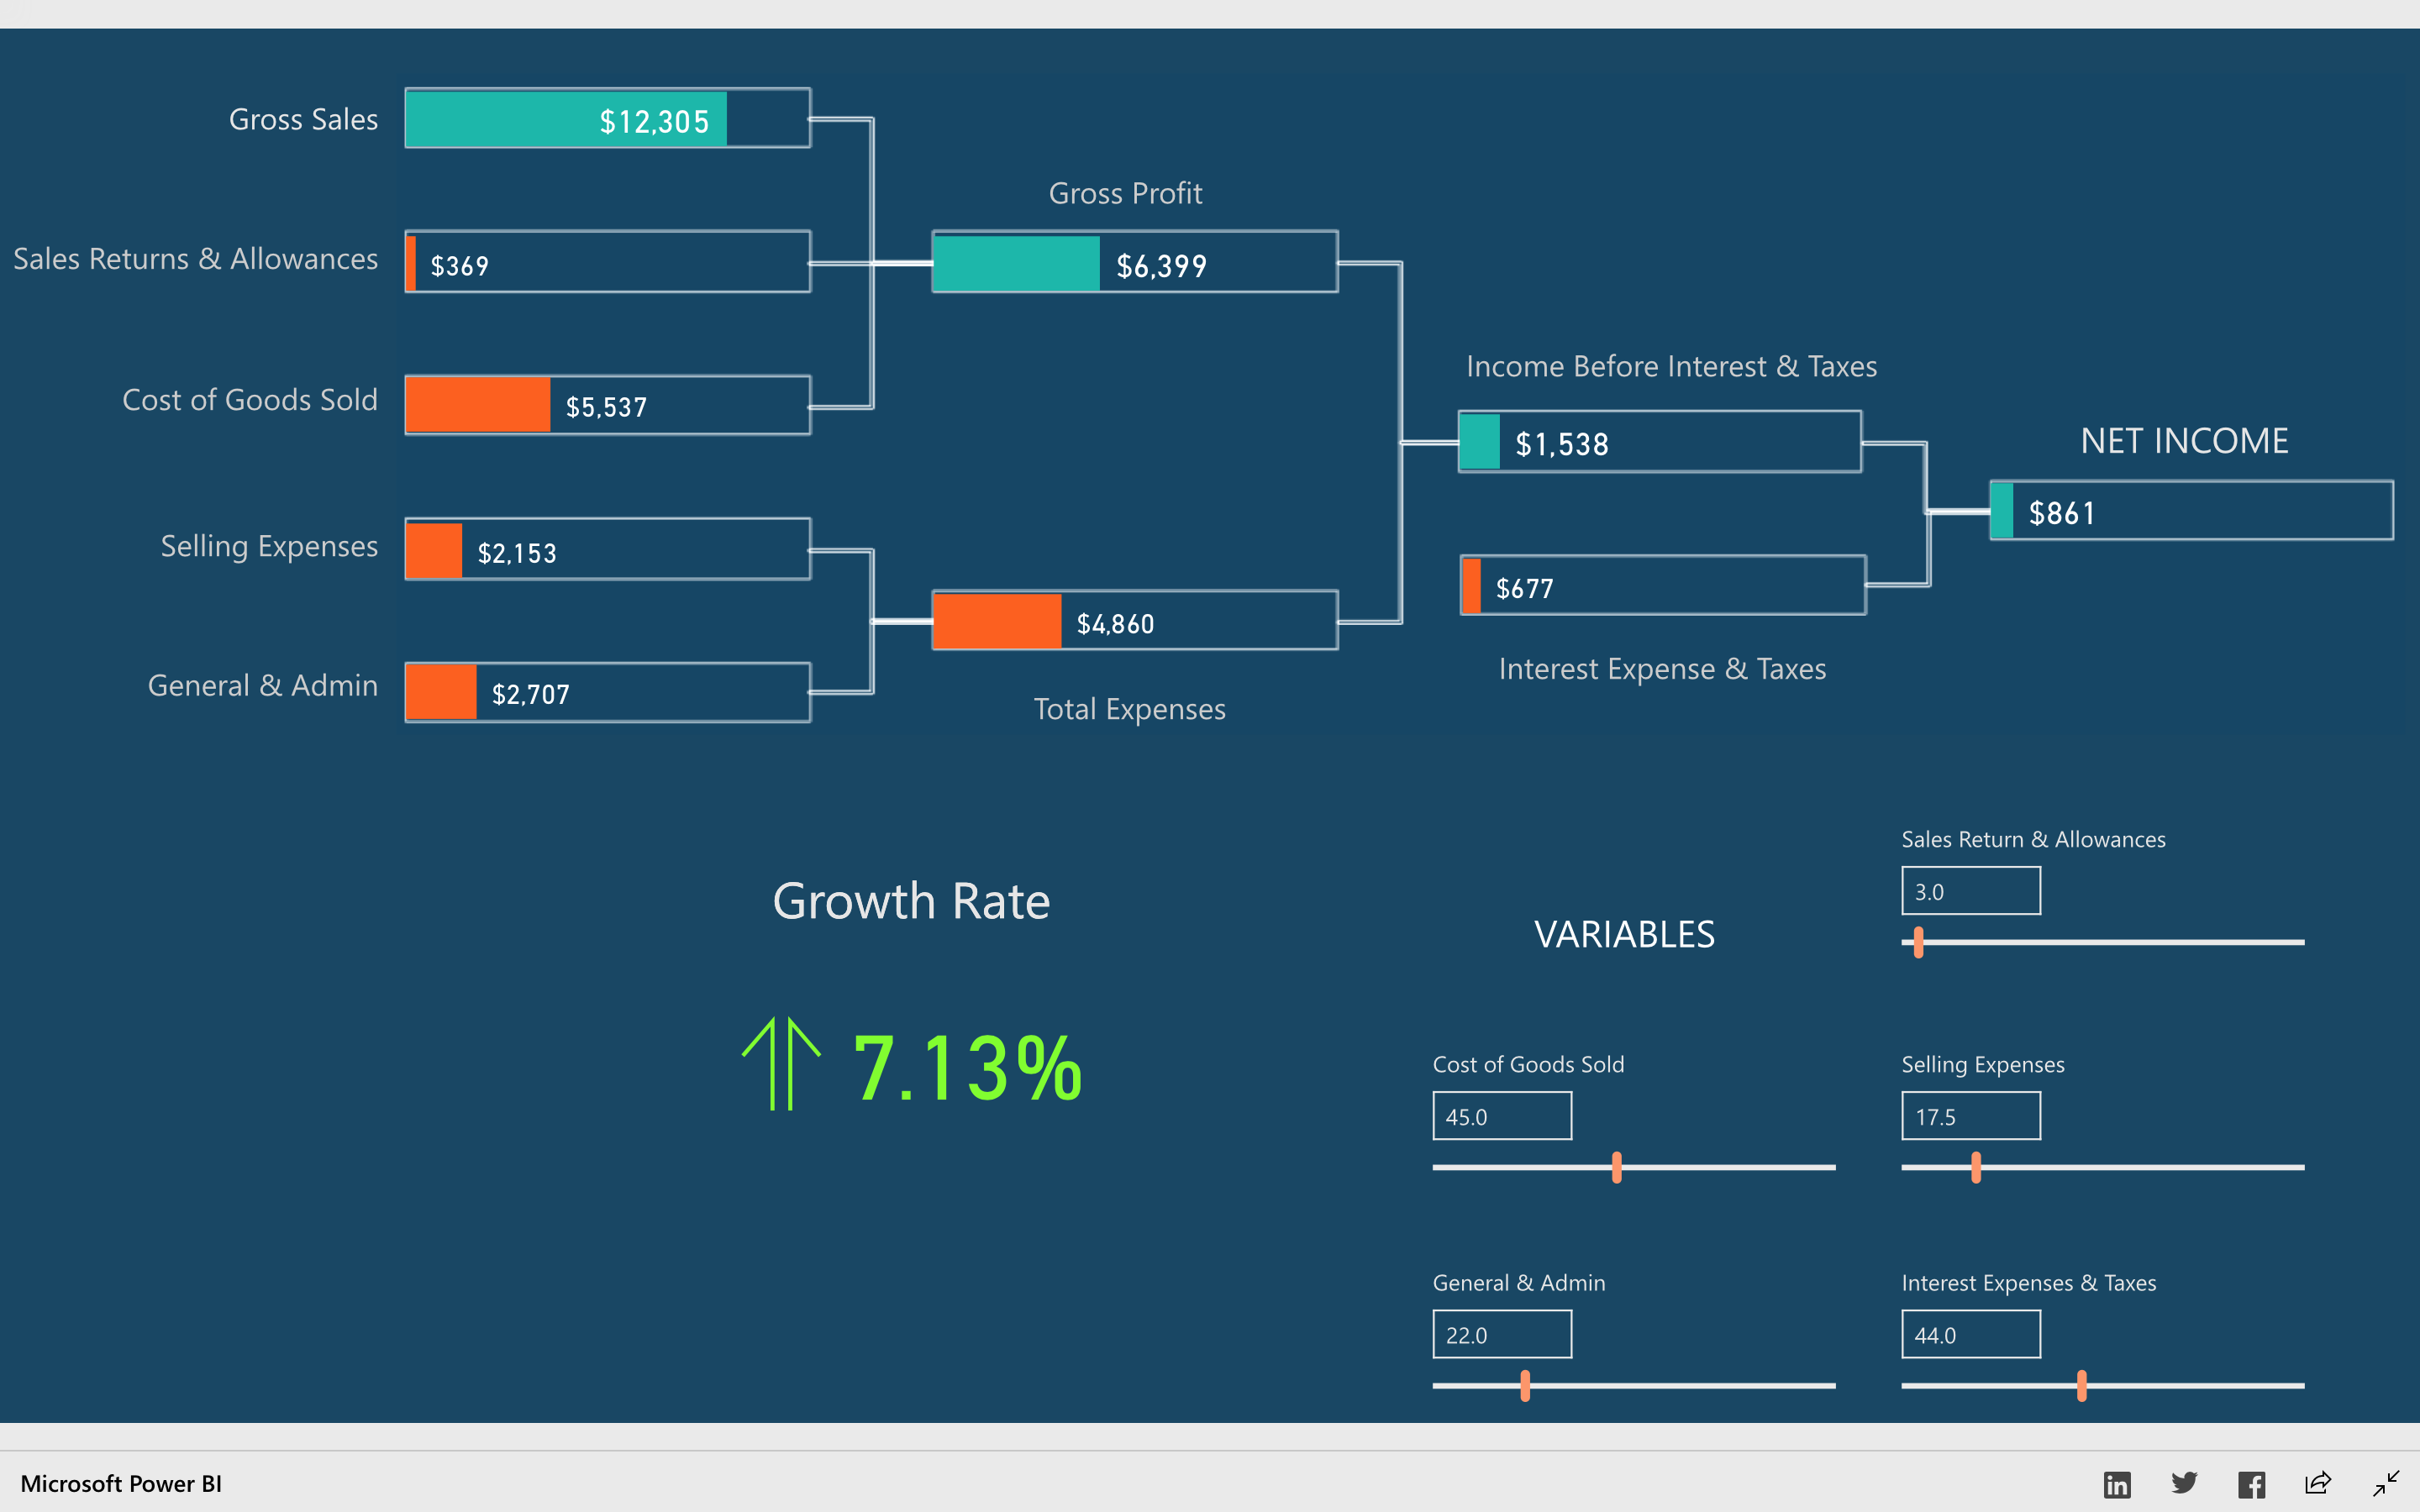
Profitability with What-if in hierarchy horizontal chart
Profitability and growth rate are important and necessary for long-term strategy in your business. I hope this report help you to analyze gaps in your business and unlock the full potential.
The Growth rate should be automatically changed Green for increasing, yellow for no changes and red for descreasing.


eyJrIjoiZDBmNTc2NzMtZDM2ZS00ODJhLTlmZDctZjIwOTRiMWFkOWY5IiwidCI6ImY4NGI5MTI0LTBlYWItNGUwZS04YmE2LWNjZGQ2NTAxODYxMSJ9
- Mark as New
- Bookmark
- Subscribe
- Mute
- Subscribe to RSS Feed
- Permalink
- Report Inappropriate Content
Great work.. Full marks on the ingenuity
- Mark as New
- Bookmark
- Subscribe
- Mute
- Subscribe to RSS Feed
- Permalink
- Report Inappropriate Content
Great example, can you please share pbix file. thanks u
- Mark as New
- Bookmark
- Subscribe
- Mute
- Subscribe to RSS Feed
- Permalink
- Report Inappropriate Content
Hi @Sohail,
I have uploaded the pbix file, please take a look and let me know if there is any concern ^_^ hope you like it.
- Mark as New
- Bookmark
- Subscribe
- Mute
- Subscribe to RSS Feed
- Permalink
- Report Inappropriate Content
Great Visualization, did you develop it?
- Mark as New
- Bookmark
- Subscribe
- Mute
- Subscribe to RSS Feed
- Permalink
- Report Inappropriate Content
Hi @daandamhuis,
For detail of implementation, I have posted in how-to topic profitability-decision-tools-with-what-if-parameters-of-power-bi
- Mark as New
- Bookmark
- Subscribe
- Mute
- Subscribe to RSS Feed
- Permalink
- Report Inappropriate Content
Thanks @daandamhuis, it's image of hierarchy horizontal (created in powerpoint) with bar charts overlapping ^_^
- Mark as New
- Bookmark
- Subscribe
- Mute
- Subscribe to RSS Feed
- Permalink
- Report Inappropriate Content
How you've tied bar charts to the hierarchy is very clever! 👏
- Mark as New
- Bookmark
- Subscribe
- Mute
- Subscribe to RSS Feed
- Permalink
- Report Inappropriate Content