Join us at FabCon Vienna from September 15-18, 2025
The ultimate Fabric, Power BI, SQL, and AI community-led learning event. Save €200 with code FABCOMM.
Get registered- Power BI forums
- Get Help with Power BI
- Desktop
- Service
- Report Server
- Power Query
- Mobile Apps
- Developer
- DAX Commands and Tips
- Custom Visuals Development Discussion
- Health and Life Sciences
- Power BI Spanish forums
- Translated Spanish Desktop
- Training and Consulting
- Instructor Led Training
- Dashboard in a Day for Women, by Women
- Galleries
- Data Stories Gallery
- Themes Gallery
- Contests Gallery
- Quick Measures Gallery
- Notebook Gallery
- Translytical Task Flow Gallery
- TMDL Gallery
- R Script Showcase
- Webinars and Video Gallery
- Ideas
- Custom Visuals Ideas (read-only)
- Issues
- Issues
- Events
- Upcoming Events
Enhance your career with this limited time 50% discount on Fabric and Power BI exams. Ends August 31st. Request your voucher.
- Power BI forums
- Galleries
- Data Stories Gallery
- Re: Contoso by SpartaBI


- Mark as New
- Bookmark
- Subscribe
- Mute
- Subscribe to RSS Feed
- Permalink
- Report Inappropriate Content
Contoso by SpartaBI
The dataset for this report is the 'Contoso 100K' from the 'Mastering Tabular Course' resources by the amazing SQLBI.com
The report layouts are the ones used in the famous 'Sales & Returns' report from Microsoft at the end of 2019 and were downloaded from the 'scrims' section in powerbi.tips.
The report has six pages (plus a home page) where each page is a showcase for different analysis requirements for a business.
In each page you will find more information about the analysis and visuals on that page.
The different pages are:
Main KPIs, Main Funnel, Sales VS Budget, Basket Analsyis, Customer Profiles, and The Customer Roulette.
The dataset is enriched with several calculation groups - among them a calculation group for dynamically display numbers, based on their value, in order to show for each number three meaningful digits (18.7M or 5.51 M on the same visual).
The dataset is also enriched with logic to support the budget and funnel scenarios. More info about that in their respective pages.
This report is optimized for the Power BI mobile app.
We'll love to hear your feedback.
Visit us at: www.spartabi.com or www.linkedin.com/company/spartabi
eyJrIjoiODdmMjY0ZDAtM2E1NS00MmNhLTkzYzUtNzY2MzBlYzg2NWFkIiwidCI6IjQ2NGVkZmFhLTc5MmQtNGZmOC04NGYwLTk0MjkwYTgzNjBhZSIsImMiOjl9
- Mark as New
- Bookmark
- Subscribe
- Mute
- Subscribe to RSS Feed
- Permalink
- Report Inappropriate Content
- Mark as New
- Bookmark
- Subscribe
- Mute
- Subscribe to RSS Feed
- Permalink
- Report Inappropriate Content
@TryAOALISome thank you :))
Check out what I wrote in the info part. I refernce there all the material you need. The famous sales and return report is available for download. Look it up in google and let me know if you need help finding it
- Mark as New
- Bookmark
- Subscribe
- Mute
- Subscribe to RSS Feed
- Permalink
- Report Inappropriate Content
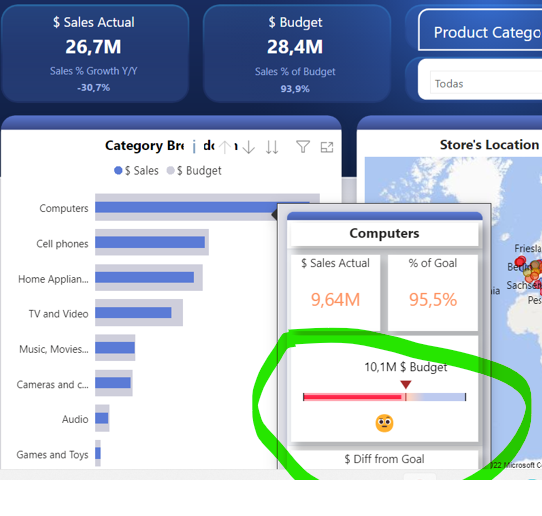
This is really cool. I wanted to know how you have added Decomposition tree pop up in your landing page. Can you refer some resources as I found that to be really appealing @SpartaBI
- Mark as New
- Bookmark
- Subscribe
- Mute
- Subscribe to RSS Feed
- Permalink
- Report Inappropriate Content
Do you mean the pop up experience?
- Mark as New
- Bookmark
- Subscribe
- Mute
- Subscribe to RSS Feed
- Permalink
- Report Inappropriate Content
- Mark as New
- Bookmark
- Subscribe
- Mute
- Subscribe to RSS Feed
- Permalink
- Report Inappropriate Content
Sure, check out what I wrote in the info part. I refernce there all the material you need. The famous sales and return report is available for download. Look it up in google and let me know if you need help finding it
- Mark as New
- Bookmark
- Subscribe
- Mute
- Subscribe to RSS Feed
- Permalink
- Report Inappropriate Content
Hi @SpartaBI , I tried to follow the info part but didn't find anything. Will it be possible for you to please guide me how to access them
- Mark as New
- Bookmark
- Subscribe
- Mute
- Subscribe to RSS Feed
- Permalink
- Report Inappropriate Content
- Mark as New
- Bookmark
- Subscribe
- Mute
- Subscribe to RSS Feed
- Permalink
- Report Inappropriate Content
- Mark as New
- Bookmark
- Subscribe
- Mute
- Subscribe to RSS Feed
- Permalink
- Report Inappropriate Content
@jrpino59 Gracias!
I used this custom visual:
https://appsource.microsoft.com/en-us/product/power-bi-visuals/wa104380821?tab=overview
- Mark as New
- Bookmark
- Subscribe
- Mute
- Subscribe to RSS Feed
- Permalink
- Report Inappropriate Content
Wow, this is very cool!
I especially liked the segmentation by Min Sales Treshold, how did you implemented this?
- Mark as New
- Bookmark
- Subscribe
- Mute
- Subscribe to RSS Feed
- Permalink
- Report Inappropriate Content
@Anonymous Thank you 🙂
A lot of DAX magic :))
Come follow our company, I will soon do a very cool webinar and will update on our page:
https://www.linkedin.com/company/spartabi
- Mark as New
- Bookmark
- Subscribe
- Mute
- Subscribe to RSS Feed
- Permalink
- Report Inappropriate Content
I liked the idea with the information button. I will definetly come to learn more how you built this.
- Mark as New
- Bookmark
- Subscribe
- Mute
- Subscribe to RSS Feed
- Permalink
- Report Inappropriate Content
Thank you @collipium
Come follow our company, I will soon do a very cool webinar and will update on our page:
https://www.linkedin.com/company/spartabi
- Mark as New
- Bookmark
- Subscribe
- Mute
- Subscribe to RSS Feed
- Permalink
- Report Inappropriate Content
I really liked the idea with the information button. Greatly simplifies navigation.
- Mark as New
- Bookmark
- Subscribe
- Mute
- Subscribe to RSS Feed
- Permalink
- Report Inappropriate Content
Thank you @ippi000 🙂
Come follow our company, I will soon do a very cool webinar and will update on our page:
https://www.linkedin.com/company/spartabi
- Mark as New
- Bookmark
- Subscribe
- Mute
- Subscribe to RSS Feed
- Permalink
- Report Inappropriate Content
Hi @SpartaBI Is there some possibility to get pbix file for viewing and check on the background how you build this DB. I would like to learn and adapt for my DB. Many thanks in advance. BR, Nipawan
- Mark as New
- Bookmark
- Subscribe
- Mute
- Subscribe to RSS Feed
- Permalink
- Report Inappropriate Content
Hey 🙂
Unfotunatlly I can't share the files but if you look at the info I wrote above I pointed to both the source of the data and to the report that inspired me and has all the layouts there. These resources are free to download, just look them up on the web according to the details I wrote and let me know if you found them. It will not have all the stuff I have in my report but it will give you a very good start.
The model itself also contains calculation groups and a lot of high level DAX code, but also for that, you just need to go sqlbi.com. I leraned most of what I know from them.
I actually created the model directly on the service with Tabular Editor and I do all the editing live on the published dataset and then connected live to it with PBIX just for the report Layer.
I do plan to create a recorded session/s and share it with everyone, not sure yet ETA. Follow us on https://www.linkedin.com/company/spartabi to get informed.
- Mark as New
- Bookmark
- Subscribe
- Mute
- Subscribe to RSS Feed
- Permalink
- Report Inappropriate Content
This looks amazing, Is there any way to download this pbix
- Mark as New
- Bookmark
- Subscribe
- Mute
- Subscribe to RSS Feed
- Permalink
- Report Inappropriate Content
How did you put the footer?
.png")
- Mark as New
- Bookmark
- Subscribe
- Mute
- Subscribe to RSS Feed
- Permalink
- Report Inappropriate Content
@Anonymous it's part of the photo and then I added the elements on top of that. I attached to layout examples but if you read the info above I direct to where exactly go to take all the building blocks for this report.