FabCon is coming to Atlanta
Join us at FabCon Atlanta from March 16 - 20, 2026, for the ultimate Fabric, Power BI, AI and SQL community-led event. Save $200 with code FABCOMM.
Register now!- Power BI forums
- Get Help with Power BI
- Desktop
- Service
- Report Server
- Power Query
- Mobile Apps
- Developer
- DAX Commands and Tips
- Custom Visuals Development Discussion
- Health and Life Sciences
- Power BI Spanish forums
- Translated Spanish Desktop
- Training and Consulting
- Instructor Led Training
- Dashboard in a Day for Women, by Women
- Galleries
- Data Stories Gallery
- Themes Gallery
- Contests Gallery
- QuickViz Gallery
- Quick Measures Gallery
- Visual Calculations Gallery
- Notebook Gallery
- Translytical Task Flow Gallery
- TMDL Gallery
- R Script Showcase
- Webinars and Video Gallery
- Ideas
- Custom Visuals Ideas (read-only)
- Issues
- Issues
- Events
- Upcoming Events
The Power BI Data Visualization World Championships is back! Get ahead of the game and start preparing now! Learn more
- Power BI forums
- Forums
- Get Help with Power BI
- DAX Commands and Tips
- sum of max values when selcting multiple slicer va...
- Subscribe to RSS Feed
- Mark Topic as New
- Mark Topic as Read
- Float this Topic for Current User
- Bookmark
- Subscribe
- Printer Friendly Page
- Mark as New
- Bookmark
- Subscribe
- Mute
- Subscribe to RSS Feed
- Permalink
- Report Inappropriate Content
sum of max values when selcting multiple slicer values
Hi,
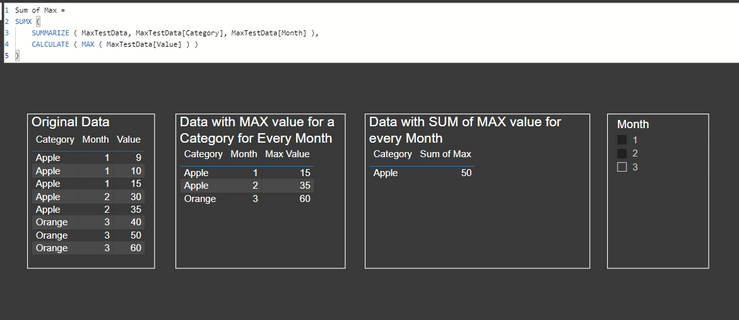
Below is the data, i have category and value fields. and Month as slicer.
each month has different values and i needd to take only max value of each month.
and here i am taking max value easily.
here the problem is.. when i select multiple months from slicer.
i need sum value of the max.
fo example. Month1 Appls has 15 as max value and in month 2 max value is 35.
when i select both months. i need to show 50 for Apple.
but here it is taking max value of the both months.
need help how to acheive this.
@Pragati11 @amitchandak @Greg_Deckler @mwegener @lbendlin @Fowmy
Solved! Go to Solution.
- Mark as New
- Bookmark
- Subscribe
- Mute
- Subscribe to RSS Feed
- Permalink
- Report Inappropriate Content
Hi @Anonymous ,
There are already existing threads for this issue:
https://community.powerbi.com/t5/Desktop/sum-of-max-values-by-date-client/td-p/247337
https://community.powerbi.com/t5/Desktop/sum-of-max-values/td-p/46715
I tried the first link's solution and it works:
Thanks,
Pragati
- Mark as New
- Bookmark
- Subscribe
- Mute
- Subscribe to RSS Feed
- Permalink
- Report Inappropriate Content
- Mark as New
- Bookmark
- Subscribe
- Mute
- Subscribe to RSS Feed
- Permalink
- Report Inappropriate Content
if i select mutiple months from slicer,
i need to see for Apple 50
not like the below. which is just taking max of the month.
- Mark as New
- Bookmark
- Subscribe
- Mute
- Subscribe to RSS Feed
- Permalink
- Report Inappropriate Content
Hi @Anonymous ,
There are already existing threads for this issue:
https://community.powerbi.com/t5/Desktop/sum-of-max-values-by-date-client/td-p/247337
https://community.powerbi.com/t5/Desktop/sum-of-max-values/td-p/46715
I tried the first link's solution and it works:
Thanks,
Pragati
- Mark as New
- Bookmark
- Subscribe
- Mute
- Subscribe to RSS Feed
- Permalink
- Report Inappropriate Content
thanks for your prompt response. this works for me.
Yes, i have gone through the links you gave below earlier.
But in their case they just want to show max values.
However in my case i need to show max values with cummulative sum based on slicer seelction.
All trick and magic lied in Summarize function.
So, i tweaked my DAX now it is working fine. 🙂
- Mark as New
- Bookmark
- Subscribe
- Mute
- Subscribe to RSS Feed
- Permalink
- Report Inappropriate Content
- Mark as New
- Bookmark
- Subscribe
- Mute
- Subscribe to RSS Feed
- Permalink
- Report Inappropriate Content
Hi @Anonymous ,
Can you paste this as a table please rather than a screenshot so that I can copy paste at my end?
Helpful resources

Power BI Dataviz World Championships
The Power BI Data Visualization World Championships is back! Get ahead of the game and start preparing now!

| User | Count |
|---|---|
| 19 | |
| 13 | |
| 8 | |
| 4 | |
| 4 |
| User | Count |
|---|---|
| 29 | |
| 22 | |
| 17 | |
| 11 | |
| 10 |


