Become a Certified Power BI Data Analyst!
Join us for an expert-led overview of the tools and concepts you'll need to pass exam PL-300. The first session starts on June 11th. See you there!
Get registered- Power BI forums
- Get Help with Power BI
- Desktop
- Service
- Report Server
- Power Query
- Mobile Apps
- Developer
- DAX Commands and Tips
- Custom Visuals Development Discussion
- Health and Life Sciences
- Power BI Spanish forums
- Translated Spanish Desktop
- Training and Consulting
- Instructor Led Training
- Dashboard in a Day for Women, by Women
- Galleries
- Webinars and Video Gallery
- Data Stories Gallery
- Themes Gallery
- Contests Gallery
- Quick Measures Gallery
- Notebook Gallery
- Translytical Task Flow Gallery
- R Script Showcase
- Ideas
- Custom Visuals Ideas (read-only)
- Issues
- Issues
- Events
- Upcoming Events
Power BI is turning 10! Let’s celebrate together with dataviz contests, interactive sessions, and giveaways. Register now.
- Power BI forums
- Forums
- Get Help with Power BI
- DAX Commands and Tips
- help with a formula to filter the sum of a calcula...
- Subscribe to RSS Feed
- Mark Topic as New
- Mark Topic as Read
- Float this Topic for Current User
- Bookmark
- Subscribe
- Printer Friendly Page
- Mark as New
- Bookmark
- Subscribe
- Mute
- Subscribe to RSS Feed
- Permalink
- Report Inappropriate Content
help with a formula to filter the sum of a calculation
Hello,
I am trying to perform what is seemingly an easy calculation but I cannot get there in DAX.
I am reading several forecats files, to which I give a version: "n" for this month, "n-1" for last month, etc.
I also have an actual spending table, with spending per month up to the latest month of available data (so no versioning).
What I need to do it to be able to sum up the actuals but only up to the date of the version selected (or version used as a legend in a chart is what I would like to achieve, to show the different curves of forecast + actual per month by file version).
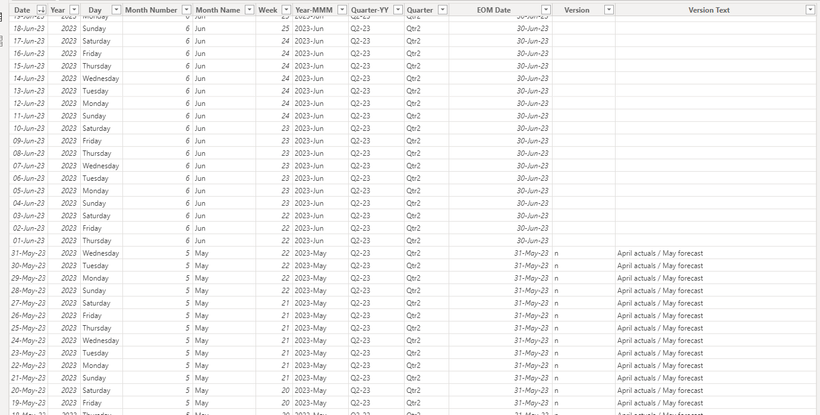
I have a table with file versions that I am reading, that I have now included in my date table (which I hope is the correct way of doing thigs):
The Actuals table just has 4 columns: Project Number, Date, Spending and Year
then I have tried to created a measure for summing the actuals, but it is not working 😞
Can you please guide me in how to do this properly?
Thanks!
Kind regards
Valeria
- Mark as New
- Bookmark
- Subscribe
- Mute
- Subscribe to RSS Feed
- Permalink
- Report Inappropriate Content
Hi @ValeriaBreve check bracket at start and at end in part VAR VersionSelected = (SELECTEDVALUE(DateTable[EOM Date])). I hope this help.
Did I answer your question? Mark my post as a solution!
Proud to be a Super User!
Helpful resources
| User | Count |
|---|---|
| 16 | |
| 15 | |
| 14 | |
| 12 | |
| 11 |
| User | Count |
|---|---|
| 19 | |
| 16 | |
| 14 | |
| 11 | |
| 9 |


