FabCon is coming to Atlanta
Join us at FabCon Atlanta from March 16 - 20, 2026, for the ultimate Fabric, Power BI, AI and SQL community-led event. Save $200 with code FABCOMM.
Register now!- Power BI forums
- Get Help with Power BI
- Desktop
- Service
- Report Server
- Power Query
- Mobile Apps
- Developer
- DAX Commands and Tips
- Custom Visuals Development Discussion
- Health and Life Sciences
- Power BI Spanish forums
- Translated Spanish Desktop
- Training and Consulting
- Instructor Led Training
- Dashboard in a Day for Women, by Women
- Galleries
- Data Stories Gallery
- Themes Gallery
- Contests Gallery
- QuickViz Gallery
- Quick Measures Gallery
- Visual Calculations Gallery
- Notebook Gallery
- Translytical Task Flow Gallery
- TMDL Gallery
- R Script Showcase
- Webinars and Video Gallery
- Ideas
- Custom Visuals Ideas (read-only)
- Issues
- Issues
- Events
- Upcoming Events
The Power BI Data Visualization World Championships is back! Get ahead of the game and start preparing now! Learn more
- Power BI forums
- Forums
- Get Help with Power BI
- DAX Commands and Tips
- fixed Average of a value when multiple dates are s...
- Subscribe to RSS Feed
- Mark Topic as New
- Mark Topic as Read
- Float this Topic for Current User
- Bookmark
- Subscribe
- Printer Friendly Page
- Mark as New
- Bookmark
- Subscribe
- Mute
- Subscribe to RSS Feed
- Permalink
- Report Inappropriate Content
fixed Average of a value when multiple dates are selected from slicer.
Hi,
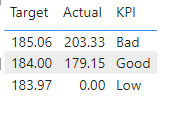
I am calculating KPI for Actuals vs Target, the target and actuals are Average values and I get single value however as soon as i add KPI into the visual i get three different KPI whereas the KPI were to be calculated based on the average of actuals and target. I am trying to get KPI when multiple dates are selected from slicer. I also have different targets for different months. for example, in the table below I wanted to get a single KPI for average of target and average of Actual. I am using a date filter and Room Name filter in this table visual.
the KPI for this visual was supposed to be bad as the average of actual is over the Average of target value.
How can i make sureto get a single KPI in this condition, i am using this kpi to format my Gauge Axis Visual. how to get a single value for Average of Target and Actual when i select multiple or a single date from the slicer.
Thank you !
Solved! Go to Solution.
- Mark as New
- Bookmark
- Subscribe
- Mute
- Subscribe to RSS Feed
- Permalink
- Report Inappropriate Content
Hi @Anonymous ,
I was Expecting this result:
Which is average of Target and Actual and KPI accordingly.
Thank You!!
- Mark as New
- Bookmark
- Subscribe
- Mute
- Subscribe to RSS Feed
- Permalink
- Report Inappropriate Content
Hi @Anonymous and All,
I figured out the solution myself, below is the DAX if you stumble upon same issues,
- Mark as New
- Bookmark
- Subscribe
- Mute
- Subscribe to RSS Feed
- Permalink
- Report Inappropriate Content
Hi @Anonymous and All,
I figured out the solution myself, below is the DAX if you stumble upon same issues,
- Mark as New
- Bookmark
- Subscribe
- Mute
- Subscribe to RSS Feed
- Permalink
- Report Inappropriate Content
Hi @Rabi ,
Can you please share some dummy data that keep the raw data structure with expected results? It should help us clarify your scenario and test to coding formula.
How to Get Your Question Answered Quickly
Regards,
Xiaoxin Sheng
- Mark as New
- Bookmark
- Subscribe
- Mute
- Subscribe to RSS Feed
- Permalink
- Report Inappropriate Content
Hi @Anonymous ,
I was Expecting this result:
Which is average of Target and Actual and KPI accordingly.
Thank You!!
- Mark as New
- Bookmark
- Subscribe
- Mute
- Subscribe to RSS Feed
- Permalink
- Report Inappropriate Content
HI @Rabi,
In fact, I want some dummy data and the expression that you used to test. They will help us clarify the data table structure and test to coding formula to create visualizations. (you can create in excel and paste in thread with table format)
BTW, did these three fields from different expressions and use on the matrix value fields?
If that is the case, you can create a new table these field names and use on matrix column. Then you can write a formula with switch function to check current column value and redirect to different measure expressions to show on the matrix.
Regards,
Xiaoxin Sheng
Helpful resources

Power BI Dataviz World Championships
The Power BI Data Visualization World Championships is back! Get ahead of the game and start preparing now!

| User | Count |
|---|---|
| 19 | |
| 13 | |
| 8 | |
| 4 | |
| 4 |
| User | Count |
|---|---|
| 29 | |
| 22 | |
| 17 | |
| 11 | |
| 10 |


