Join the #PBI10 DataViz contest
Power BI is turning 10, and we’re marking the occasion with a special community challenge. Use your creativity to tell a story, uncover trends, or highlight something unexpected.
Get started- Power BI forums
- Get Help with Power BI
- Desktop
- Service
- Report Server
- Power Query
- Mobile Apps
- Developer
- DAX Commands and Tips
- Custom Visuals Development Discussion
- Health and Life Sciences
- Power BI Spanish forums
- Translated Spanish Desktop
- Training and Consulting
- Instructor Led Training
- Dashboard in a Day for Women, by Women
- Galleries
- Webinars and Video Gallery
- Data Stories Gallery
- Themes Gallery
- Contests Gallery
- Quick Measures Gallery
- Notebook Gallery
- Translytical Task Flow Gallery
- R Script Showcase
- Ideas
- Custom Visuals Ideas (read-only)
- Issues
- Issues
- Events
- Upcoming Events
Join us for an expert-led overview of the tools and concepts you'll need to become a Certified Power BI Data Analyst and pass exam PL-300. Register now.
- Power BI forums
- Forums
- Get Help with Power BI
- DAX Commands and Tips
- create if condition based on three columns in diff...
- Subscribe to RSS Feed
- Mark Topic as New
- Mark Topic as Read
- Float this Topic for Current User
- Bookmark
- Subscribe
- Printer Friendly Page

- Mark as New
- Bookmark
- Subscribe
- Mute
- Subscribe to RSS Feed
- Permalink
- Report Inappropriate Content
create if condition based on three columns in different tables
I have this 3 tables
table1:
| id | hasE? |
| 1 | 1 |
| 2 | 1 |
| 5 | 0 |
| 6 | 0 |
| 8 | 1 |
| 9 | 1 |
table2:
| id | hasK? |
| 1 | 1 |
| 2 | 1 |
| 5 | 0 |
| 6 | 0 |
| 8 | 0 |
| 9 | 0 |
table3:
| id | hasU? |
| 1 | 0 |
| 2 | 0 |
| 5 | 0 |
| 6 | 0 |
| 8 | 1 |
| 9 | 1 |
and the tables has id to make relations between them
I want to create if condation in dax to compare between this three columns (hasE?,hasK?,hasU?) if one of them has 1 return true else false
here is how i imagine it:
Status = IF('table1'[hasE?]=1 || 'table2'[hasK?]=1 || 'table3'[hasU?]=1 ,"true","false")Solved! Go to Solution.


- Mark as New
- Bookmark
- Subscribe
- Mute
- Subscribe to RSS Feed
- Permalink
- Report Inappropriate Content
Hi, @Anonymous
Please check the below picture and the sample pbix file's link down below.
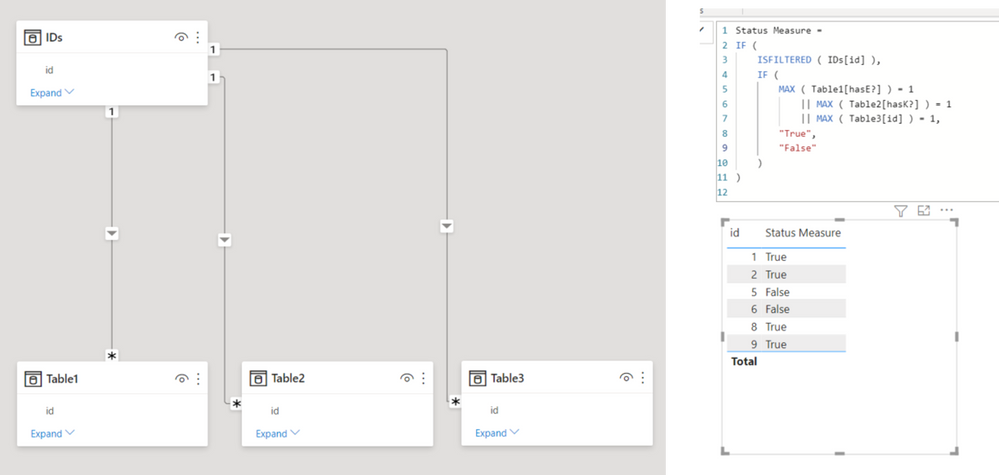
Status Measure =
IF (
ISFILTERED ( IDs[id] ),
IF (
MAX ( Table1[hasE?] ) = 1
|| MAX ( Table2[hasK?] ) = 1
|| MAX ( Table3[id] ) = 1,
"True",
"False"
)
)
https://www.dropbox.com/s/ab5hnvsba4315nh/fatimah.pbix?dl=0
Hi, My name is Jihwan Kim.
If this post helps, then please consider accept it as the solution to help other members find it faster, and give a big thumbs up.
Linkedin: linkedin.com/in/jihwankim1975/
Twitter: twitter.com/Jihwan_JHKIM
If this post helps, then please consider accepting it as the solution to help other members find it faster, and give a big thumbs up.
Click here to visit my LinkedIn page
Click here to schedule a short Teams meeting to discuss your question.
- Mark as New
- Bookmark
- Subscribe
- Mute
- Subscribe to RSS Feed
- Permalink
- Report Inappropriate Content
Hi, @Anonymous
I am not sure how your desired output looks like. Please check the link down below, otherwise, please share how your expected output looks like.
https://www.dropbox.com/s/ab5hnvsba4315nh/fatimah.pbix?dl=0
Hi, My name is Jihwan Kim.
If this post helps, then please consider accept it as the solution to help other members find it faster, and give a big thumbs up.
Linkedin: linkedin.com/in/jihwankim1975/
Twitter: twitter.com/Jihwan_JHKIM
If this post helps, then please consider accepting it as the solution to help other members find it faster, and give a big thumbs up.
Click here to visit my LinkedIn page
Click here to schedule a short Teams meeting to discuss your question.
- Mark as New
- Bookmark
- Subscribe
- Mute
- Subscribe to RSS Feed
- Permalink
- Report Inappropriate Content
Hi, @Anonymous
Please check the below picture and the sample pbix file's link down below.
Status Measure =
IF (
ISFILTERED ( IDs[id] ),
IF (
MAX ( Table1[hasE?] ) = 1
|| MAX ( Table2[hasK?] ) = 1
|| MAX ( Table3[id] ) = 1,
"True",
"False"
)
)
https://www.dropbox.com/s/ab5hnvsba4315nh/fatimah.pbix?dl=0
Hi, My name is Jihwan Kim.
If this post helps, then please consider accept it as the solution to help other members find it faster, and give a big thumbs up.
Linkedin: linkedin.com/in/jihwankim1975/
Twitter: twitter.com/Jihwan_JHKIM
If this post helps, then please consider accepting it as the solution to help other members find it faster, and give a big thumbs up.
Click here to visit my LinkedIn page
Click here to schedule a short Teams meeting to discuss your question.
- Mark as New
- Bookmark
- Subscribe
- Mute
- Subscribe to RSS Feed
- Permalink
- Report Inappropriate Content
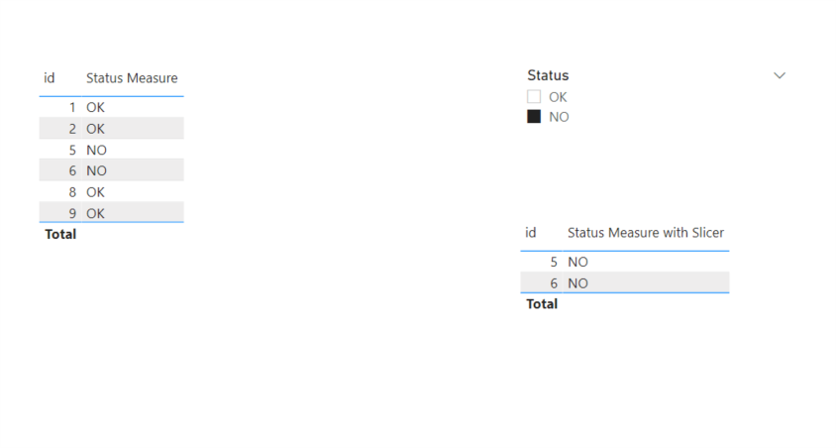
thank you but it there any way to use the measure with slicer visual?
- Mark as New
- Bookmark
- Subscribe
- Mute
- Subscribe to RSS Feed
- Permalink
- Report Inappropriate Content
Hi, @Anonymous
I am not sure how your desired output looks like. Please check the link down below, otherwise, please share how your expected output looks like.
https://www.dropbox.com/s/ab5hnvsba4315nh/fatimah.pbix?dl=0
Hi, My name is Jihwan Kim.
If this post helps, then please consider accept it as the solution to help other members find it faster, and give a big thumbs up.
Linkedin: linkedin.com/in/jihwankim1975/
Twitter: twitter.com/Jihwan_JHKIM
If this post helps, then please consider accepting it as the solution to help other members find it faster, and give a big thumbs up.
Click here to visit my LinkedIn page
Click here to schedule a short Teams meeting to discuss your question.
- Mark as New
- Bookmark
- Subscribe
- Mute
- Subscribe to RSS Feed
- Permalink
- Report Inappropriate Content
yes as I need thank you so much

- Mark as New
- Bookmark
- Subscribe
- Mute
- Subscribe to RSS Feed
- Permalink
- Report Inappropriate Content
@Anonymous , You can not do it like this.
Either you have to create a common is a table and join all with those and create a column there.
How to do that - https://www.seerinteractive.com/blog/join-many-many-power-bi/
There 4 ways refer data of me table into another tbale
https://www.youtube.com/watch?v=Wu1mWxR23jU
https://www.youtube.com/watch?v=czNHt7UXIe8
Helpful resources

Join our Fabric User Panel
This is your chance to engage directly with the engineering team behind Fabric and Power BI. Share your experiences and shape the future.

Power BI Monthly Update - June 2025
Check out the June 2025 Power BI update to learn about new features.

Fabric Community Update - June 2025
Find out what's new and trending in the Fabric community.

| User | Count |
|---|---|
| 10 | |
| 9 | |
| 8 | |
| 7 | |
| 6 |


| User | Count |
|---|---|
| 14 | |
| 13 | |
| 11 | |
| 9 | |
| 9 |


