This time we’re going bigger than ever. Fabric, Power BI, SQL, AI and more. We're covering it all. You won't want to miss it.
Learn moreLevel up your Power BI skills this month - build one visual each week and tell better stories with data! Get started
Good Day,
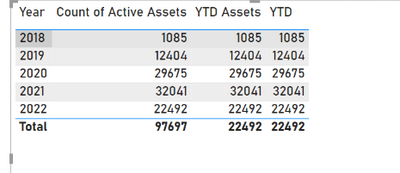
I am trying to get a running total by year but am just getting the total of each year. What I am wanting is a running total by year. So for instance 2018 has 1085 as the count and 2019 has 12404 as the count on the matrix I would like 2019 to be a sum of 2018 & 2019 and to continue on for the rest of the years. Can someone help me through this madness?
Current Formula:
Many Thanks,
Your friendly neighborhood Lydia
Solved! Go to Solution.
@Anonymous Try Better Running Total: Better Running Total - Microsoft Power BI Community
Better RT =
VAR __Date = MAX('Assets'[Created_Date])
VAR __Table = FILTER(ALLSELECTED('Assets'),[Created_Date] <= __Date)
RETURN
SUMX(__Table,[Status Bit])
@Anonymous Try Better Running Total: Better Running Total - Microsoft Power BI Community
Better RT =
VAR __Date = MAX('Assets'[Created_Date])
VAR __Table = FILTER(ALLSELECTED('Assets'),[Created_Date] <= __Date)
RETURN
SUMX(__Table,[Status Bit])
Sign up to receive a private message when registration opens and key events begin.
If you have recently started exploring Fabric, we'd love to hear how it's going. Your feedback can help with product improvements.
| User | Count |
|---|---|
| 5 | |
| 4 | |
| 4 | |
| 3 | |
| 3 |
| User | Count |
|---|---|
| 9 | |
| 9 | |
| 7 | |
| 6 | |
| 6 |