FabCon is coming to Atlanta
Join us at FabCon Atlanta from March 16 - 20, 2026, for the ultimate Fabric, Power BI, AI and SQL community-led event. Save $200 with code FABCOMM.
Register now!- Power BI forums
- Get Help with Power BI
- Desktop
- Service
- Report Server
- Power Query
- Mobile Apps
- Developer
- DAX Commands and Tips
- Custom Visuals Development Discussion
- Health and Life Sciences
- Power BI Spanish forums
- Translated Spanish Desktop
- Training and Consulting
- Instructor Led Training
- Dashboard in a Day for Women, by Women
- Galleries
- Data Stories Gallery
- Themes Gallery
- Contests Gallery
- Quick Measures Gallery
- Notebook Gallery
- Translytical Task Flow Gallery
- TMDL Gallery
- R Script Showcase
- Webinars and Video Gallery
- Ideas
- Custom Visuals Ideas (read-only)
- Issues
- Issues
- Events
- Upcoming Events
Calling all Data Engineers! Fabric Data Engineer (Exam DP-700) live sessions are back! Starting October 16th. Sign up.
- Power BI forums
- Forums
- Get Help with Power BI
- DAX Commands and Tips
- Variance calculation in Table or Matrix
- Subscribe to RSS Feed
- Mark Topic as New
- Mark Topic as Read
- Float this Topic for Current User
- Bookmark
- Subscribe
- Printer Friendly Page
- Mark as New
- Bookmark
- Subscribe
- Mute
- Subscribe to RSS Feed
- Permalink
- Report Inappropriate Content
Variance calculation in Table or Matrix
Hi everyone
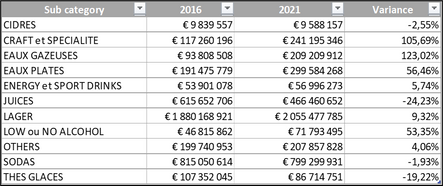
I'm doing a sales comparison report in which the end user can pick any 2 dates in a slicer (2016 and 2021 in below example).
To show the results, I'm trying to achieve this visual made with excel :
In PBI I used a table and a matrix to visualize the results but i can't replicate the excel table above.
1/ TABLE
I went first for a table for which I created 3 measures :
a) SalesTotal_YearOldest = CALCULATE([SalesTotal], FILTER(CALENDRIER, CALENDRIER[Year]=MIN(CALENDRIER[Year] ))) ----- to show 2016 results
b) SalesTotal_YearMostRecent = CALCULATE([SalesTotal], FILTER(CALENDRIER, CALENDRIER[Year]=MAX(CALENDRIER[Year] ))) ----- to show 2021 results
c) Variance = [SalesTotal_YearMostRecent] - [SalesTotal_YearOldest] / [SalesTotal_YearOldest]
Here's the visual :
This table is ok but i can't find a way to have dynamic column headers : YEAR(oldest) would be 2016 and YEAR(most recent) would be 2021 (based on the years picked in the slicer).
I've read many posts on dynamic column headers but it seems it's not possible for tables (unless you have an idea on how to do it ?).
So i opted for a matrix.
2/ MATRIX
Here's the visual without the Variance measure :
Problem is i can't use the Variance measure in that matrix. The measure won't stay in the "Colonnes" field when i try to drag and drop the measure in. And when i put it in the "Valeurs" field, here's what it does :
Can anyone help me out reproducing the screenshot excel table please ?
Here's the data model if it can be of any help :
I hope my explanations are clear and detailed enough.
Thank you 🙏
Solved! Go to Solution.
- Mark as New
- Bookmark
- Subscribe
- Mute
- Subscribe to RSS Feed
- Permalink
- Report Inappropriate Content
Hi @AnthNC ,
Based on your description, I have created a simple example:
Please try:
Measure =
var _a = CALCULATE(SUM('Table'[Value]),FILTER('Table',[Year]=MIN('Table'[Year])))
var _b = CALCULATE(SUM('Table'[Value]),FILTER('Table',[Year]=MAX('Table'[Year])))
return
IF(ISINSCOPE('Table'[Year]),SUM('Table'[Value]),FORMAT(DIVIDE(_b-_a,_a),"Percent"))
Change the name of column subtotal:
Final output:
Best Regards,
Jianbo Li
If this post helps, then please consider Accept it as the solution to help the other members find it more quickly.
- Mark as New
- Bookmark
- Subscribe
- Mute
- Subscribe to RSS Feed
- Permalink
- Report Inappropriate Content
This is a very clear example thanks for that.
Question, I'm computing a numeric rather than percentage variance. In my (very large) dataset there may be instances where the "subcategory" isn't present in a "year". How can I incorporate COALESCE into the above in order to compute a variance where for a given "subcategory", one "year" is BLANK?
I've tried inserting in both the variables and in the IF(INSCOPE line without any success.
| subcategory | 2016 | 2018 | Variance |
| a | 90 | 90 | |
| b | 20 | 80 | 60 |
| c | 30 | 70 | 40 |
I would've thought this usage of COALESCE would accomplish my objective but I'm stuck:
- Mark as New
- Bookmark
- Subscribe
- Mute
- Subscribe to RSS Feed
- Permalink
- Report Inappropriate Content
Many thanks Jianbo Li !
I'm finding out about how to use variables in measures. Thanks again
Helpful resources

FabCon Global Hackathon
Join the Fabric FabCon Global Hackathon—running virtually through Nov 3. Open to all skill levels. $10,000 in prizes!

Power BI Monthly Update - September 2025
Check out the September 2025 Power BI update to learn about new features.

| User | Count |
|---|---|
| 9 | |
| 8 | |
| 7 | |
| 4 | |
| 3 |


