This time we’re going bigger than ever. Fabric, Power BI, SQL, AI and more. We're covering it all. You won't want to miss it.
Learn moreLevel up your Power BI skills this month - build one visual each week and tell better stories with data! Get started
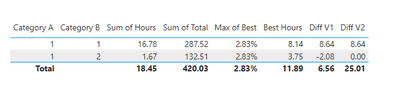
I have the data in the below format, I am trying to get the difference between the best and hours while neglecting the negatives in total. So the diff column in the visual should show 8.64 instead of 6.56. I have tried Inscope and it is not working, am i missing something here?
Here is the link for the file.
Solved! Go to Solution.
@Sidhu Try this:
Diff V3 =
VAR __Table =
ADDCOLUMNS(
ADDCOLUMNS(
SUMMARIZE( 'Table', [Category A], [Category B], "__Hours", SUM( 'Table'[Hours] ) ),
"__BestHours", [Best Hours]
),
"__Diff", [__Hours] - [__BestHours]
)
VAR __Diff = [Diff V1]
VAR __Result =
IF(
ISINSCOPE( 'Table'[Category A] ),
__Diff,
SUMX( FILTER( __Table, [__Diff] > 0 ), [__Diff] )
)
RETURN
__Result
@Sidhu First, please vote for this idea: https://ideas.powerbi.com/ideas/idea/?ideaid=082203f1-594f-4ba7-ac87-bb91096c742e
This looks like a measure totals problem. Very common. See my post about it here: https://community.powerbi.com/t5/DAX-Commands-and-Tips/Dealing-with-Measure-Totals/td-p/63376
Also, this Quick Measure, Measure Totals, The Final Word should get you what you need:
https://community.powerbi.com/t5/Quick-Measures-Gallery/Measure-Totals-The-Final-Word/m-p/547907
Also: https://youtu.be/uXRriTN0cfY
And: https://youtu.be/n4TYhF2ARe8
Hi @Greg_Deckler ,
Thanks for quick response, I have tried the methods which you mentioned. It is not working properly, I tried InScope, HasOneValue & HasOneFilter. I think the way my data is represented might be causing issues. Can you take a look at the file which I added in the earlier post?
@Sidhu Try this:
Diff V3 =
VAR __Table =
ADDCOLUMNS(
ADDCOLUMNS(
SUMMARIZE( 'Table', [Category A], [Category B], "__Hours", SUM( 'Table'[Hours] ) ),
"__BestHours", [Best Hours]
),
"__Diff", [__Hours] - [__BestHours]
)
VAR __Diff = [Diff V1]
VAR __Result =
IF(
ISINSCOPE( 'Table'[Category A] ),
__Diff,
SUMX( FILTER( __Table, [__Diff] > 0 ), [__Diff] )
)
RETURN
__Result
Thank you, it is working now.
@Sidhu Sure, I'll give it a once over.
Check out the April 2026 Power BI update to learn about new features.
Sign up to receive a private message when registration opens and key events begin.
If you have recently started exploring Fabric, we'd love to hear how it's going. Your feedback can help with product improvements.
| User | Count |
|---|---|
| 4 | |
| 3 | |
| 3 | |
| 2 | |
| 2 |
| User | Count |
|---|---|
| 6 | |
| 6 | |
| 6 | |
| 5 | |
| 4 |