This time we’re going bigger than ever. Fabric, Power BI, SQL, AI and more. We're covering it all. You won't want to miss it.
Learn moreLevel up your Power BI skills this month - build one visual each week and tell better stories with data! Get started
Hi All
Am new to PowerBI so I hope this isn't too elementary. Searched the forums and help videos but not getting something I need exactly for consolidated data. Have had partial success with measures not managed a solution for full page. Below is sample set of a larger usecase.
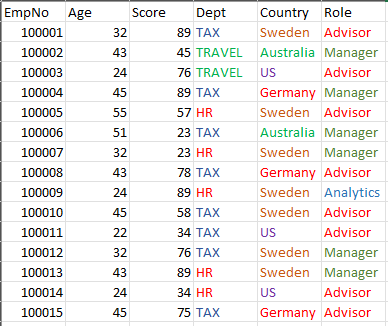
For the below data/report, I have just one simple table. Based on all the slicers/filters on the page, I want to limit the data shown to only where more than 5 records available.
Data:
Report:
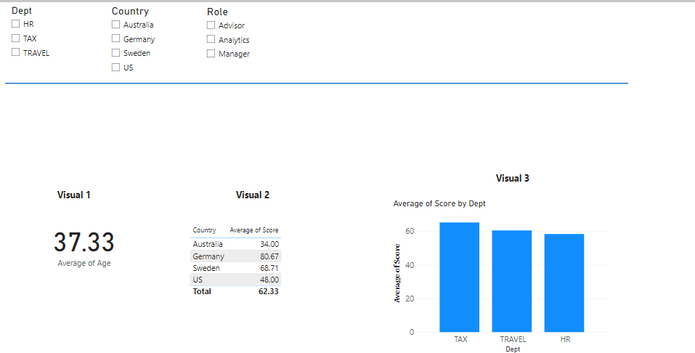
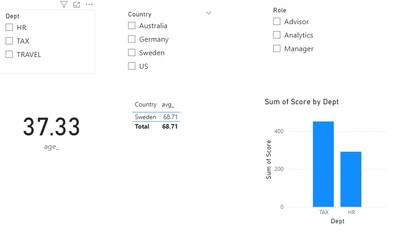
All the 3 visuals have averages (consolidated data). With the below data I need to limit to at least 5 responses, for example:
1) If no slicers selected.
- Visual 1 is ok, uses all records
- Visual 2 should only show sweden data as Sweden has >= 5 records while other countries dont
- Visual 3 should only show Tax and HR, as travel has < 5 records
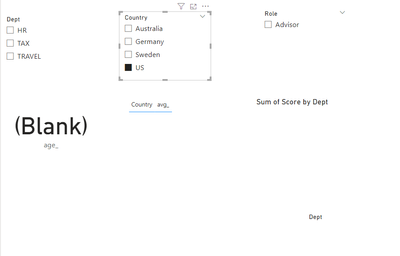
2) Lets say US is filtered in one slicer
- All 3 visuals should not show data as all visual components pull from < 5 records
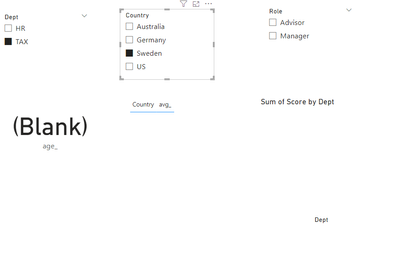
3) If TAX and SWEDEN selected in different slicers
- Again, all 3 visuals should not show data as all visual components pull from < 5 records
If when data is suppressed and I can add some comment like 'Not enough data' this is an additional bonus.
Solved! Go to Solution.
Hi @LJLSR ,
Try formula like below:
age_ =
IF (
SELECTEDVALUE ( Sheet[Country] ) = "US",
BLANK (),
IF (
SELECTEDVALUE ( Sheet[Dept] ) & " "
& SELECTEDVALUE ( Sheet[Country] ) = "TAX Sweden",
BLANK (),
AVERAGE ( [Age] )
)
)
result1 =
VAR count_ =
COUNTROWS ( FILTER ( Sheet, Sheet[Country] = MAX ( Sheet[Country] ) ) )
RETURN
IF (
SELECTEDVALUE ( Sheet[Country] ) = "US",
BLANK (),
IF (
SELECTEDVALUE ( Sheet[Dept] ) & " "
& SELECTEDVALUE ( Sheet[Country] ) = "TAX Sweden",
BLANK (),
IF ( ISBLANK ( SELECTEDVALUE ( Sheet[Dept] ) ) && count_ > 5, 1, 0 )
)
)
result2 =
VAR count_ =
COUNTROWS ( FILTER ( Sheet, Sheet[Dept] = MAX ( Sheet[Dept] ) ) )
RETURN
IF (
SELECTEDVALUE ( Sheet[Country] ) = "US",
BLANK (),
IF (
SELECTEDVALUE ( Sheet[Dept] ) & " "
& SELECTEDVALUE ( Sheet[Country] ) = "TAX Sweden",
BLANK (),
IF ( count_ < 5, 0, 1 )
)
)
Best Regards,
Adamk Kong
If this post helps, then please consider Accept it as the solution to help the other members find it more quickly.
Hi @LJLSR ,
Try formula like below:
age_ =
IF (
SELECTEDVALUE ( Sheet[Country] ) = "US",
BLANK (),
IF (
SELECTEDVALUE ( Sheet[Dept] ) & " "
& SELECTEDVALUE ( Sheet[Country] ) = "TAX Sweden",
BLANK (),
AVERAGE ( [Age] )
)
)
result1 =
VAR count_ =
COUNTROWS ( FILTER ( Sheet, Sheet[Country] = MAX ( Sheet[Country] ) ) )
RETURN
IF (
SELECTEDVALUE ( Sheet[Country] ) = "US",
BLANK (),
IF (
SELECTEDVALUE ( Sheet[Dept] ) & " "
& SELECTEDVALUE ( Sheet[Country] ) = "TAX Sweden",
BLANK (),
IF ( ISBLANK ( SELECTEDVALUE ( Sheet[Dept] ) ) && count_ > 5, 1, 0 )
)
)
result2 =
VAR count_ =
COUNTROWS ( FILTER ( Sheet, Sheet[Dept] = MAX ( Sheet[Dept] ) ) )
RETURN
IF (
SELECTEDVALUE ( Sheet[Country] ) = "US",
BLANK (),
IF (
SELECTEDVALUE ( Sheet[Dept] ) & " "
& SELECTEDVALUE ( Sheet[Country] ) = "TAX Sweden",
BLANK (),
IF ( count_ < 5, 0, 1 )
)
)
Best Regards,
Adamk Kong
If this post helps, then please consider Accept it as the solution to help the other members find it more quickly.
Check out the April 2026 Power BI update to learn about new features.
Sign up to receive a private message when registration opens and key events begin.
If you have recently started exploring Fabric, we'd love to hear how it's going. Your feedback can help with product improvements.
| User | Count |
|---|---|
| 3 | |
| 3 | |
| 3 | |
| 3 | |
| 2 |
| User | Count |
|---|---|
| 8 | |
| 8 | |
| 7 | |
| 6 | |
| 6 |