New Offer! Become a Certified Fabric Data Engineer
Check your eligibility for this 50% exam voucher offer and join us for free live learning sessions to get prepared for Exam DP-700.
Get Started- Power BI forums
- Get Help with Power BI
- Desktop
- Service
- Report Server
- Power Query
- Mobile Apps
- Developer
- DAX Commands and Tips
- Custom Visuals Development Discussion
- Health and Life Sciences
- Power BI Spanish forums
- Translated Spanish Desktop
- Training and Consulting
- Instructor Led Training
- Dashboard in a Day for Women, by Women
- Galleries
- Community Connections & How-To Videos
- COVID-19 Data Stories Gallery
- Themes Gallery
- Data Stories Gallery
- R Script Showcase
- Webinars and Video Gallery
- Quick Measures Gallery
- 2021 MSBizAppsSummit Gallery
- 2020 MSBizAppsSummit Gallery
- 2019 MSBizAppsSummit Gallery
- Events
- Ideas
- Custom Visuals Ideas
- Issues
- Issues
- Events
- Upcoming Events
Don't miss out! 2025 Microsoft Fabric Community Conference, March 31 - April 2, Las Vegas, Nevada. Use code MSCUST for a $150 discount. Prices go up February 11th. Register now.
- Power BI forums
- Forums
- Get Help with Power BI
- DAX Commands and Tips
- Re: SumX of 2 Composite Curves
- Subscribe to RSS Feed
- Mark Topic as New
- Mark Topic as Read
- Float this Topic for Current User
- Bookmark
- Subscribe
- Printer Friendly Page
- Mark as New
- Bookmark
- Subscribe
- Mute
- Subscribe to RSS Feed
- Permalink
- Report Inappropriate Content
SumX of 2 Composite Curves
Hello All,
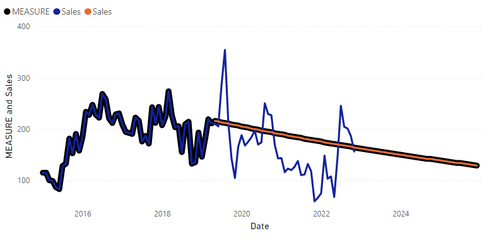
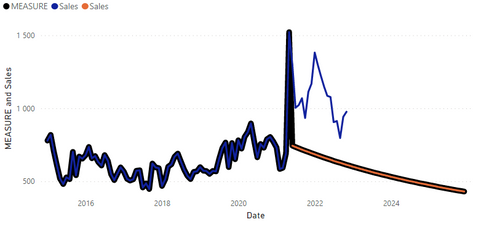
I have 2 different products, Product 1 & Product 2. For each product, I have plotted the [Sales] and [Expected], in blue and orange respectively. I have created a new measure that combines the two by taking the [Sales] curve which switches to [Expected] when it begins.
MEASURE =

var _tbl =
ALLSELECTED ( Expected )
var cutoff =
CALCULATE ( MINX ( _tbl, [Date] ) )

return

CALCULATE (
    SUM ( Sales[Sales] ),
    FILTER ( _calendar, _calendar[Date] < cutoff )
)
    + SUM ( Expected[Sales] )
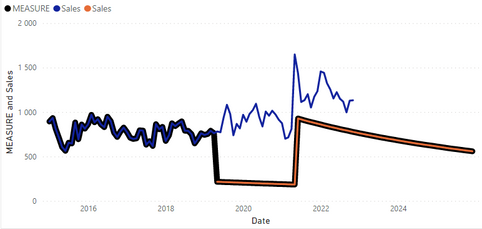
When I select both products however, they do not sum properly. I believe there is an issue with either my variable 'cutoff' (MINX), or '_tbl' (ALLSELECTED), but I have had no luck fixing it. Could I please get some advice?
Product 1:
Product 2:
Both Selected:
See the dip between the start of the 1st and 2nd [Expected] curves.
I have included the sample file below. Please let me know if you have issues accessing it.
Note: I would like for the measure to apply to each product first, then sum the result. Not sum the curves then apply the measure.
Thank you!
Solved! Go to Solution.
- Mark as New
- Bookmark
- Subscribe
- Mute
- Subscribe to RSS Feed
- Permalink
- Report Inappropriate Content
If you define measures [SumSales] = SUM ( Sales[Sales] ) and [ExpectedSales] = SUM ( Expected[Sales] ), then you can write the composite like this:
SUMX (
    'Product',
    IF (
        ISBLANK ( [ExpectedSales] ),
        [SumSales],
        [ExpectedSales]
    )
)
Note: IF.EAGER instead of IF may be slightly more efficient here.
- Mark as New
- Bookmark
- Subscribe
- Mute
- Subscribe to RSS Feed
- Permalink
- Report Inappropriate Content
Hi @Palmtop ,
Please try:
Measure2 =
VAR _a =
    SELECTCOLUMNS ( 'Product', "Product", [Product] )
VAR _b =
    ADDCOLUMNS (
        _a,
        "cutoff",
            MINX (
                FILTER ( ALL ( 'Expected' ), [Product] = EARLIER ( [Product] ) ),
                [date]
            ),
        "Sales",
            CALCULATE (
                SUM ( Sales[Sales] ),
                FILTER ( 'Sales', [Product] = EARLIER ( [Product] ) )
            ),
        "Expected",
            CALCULATE (
                SUM ( Expected[Sales] ),
                FILTER ( 'Expected', [Product] = EARLIER ( [Product] ) )
            )
    )
VAR _c =
    ADDCOLUMNS (
        _b,
        "Value", IF ( MAX ( '_calendar'[Date] ) < [cutoff], [Sales], [Expected] )
    )
RETURN
    SUMX ( _c, [Value] )
Final output:
Best Regards,
Jianbo Li
If this post helps, then please consider Accept it as the solution to help the other members find it more quickly.
- Mark as New
- Bookmark
- Subscribe
- Mute
- Subscribe to RSS Feed
- Permalink
- Report Inappropriate Content
If you define measures [SumSales] = SUM ( Sales[Sales] ) and [ExpectedSales] = SUM ( Expected[Sales] ), then you can write the composite like this:
SUMX (
    'Product',
    IF (
        ISBLANK ( [ExpectedSales] ),
        [SumSales],
        [ExpectedSales]
    )
)
Note: IF.EAGER instead of IF may be slightly more efficient here.
- Mark as New
- Bookmark
- Subscribe
- Mute
- Subscribe to RSS Feed
- Permalink
- Report Inappropriate Content
Thank you @AlexisOlson , worked like a charm. I had tried a sumx before trying the posted measure but had not thought to include the IF ( ISBLANK ( ) ) condition.
@v-jianboli-msft Your solution also worked for me as well, thank you.
Helpful resources

Join us at the Microsoft Fabric Community Conference
March 31 - April 2, 2025, in Las Vegas, Nevada. Use code MSCUST for a $150 discount! Prices go up Feb. 11th.

Join our Community Sticker Challenge 2025
If you love stickers, then you will definitely want to check out our Community Sticker Challenge!

Power BI Monthly Update - January 2025
Check out the January 2025 Power BI update to learn about new features in Reporting, Modeling, and Data Connectivity.

| User | Count |
|---|---|
| 21 | |
| 15 | |
| 15 | |
| 11 | |
| 7 |
| User | Count |
|---|---|
| 25 | |
| 24 | |
| 12 | |
| 12 | |
| 11 |


