Join the #PBI10 DataViz contest
Power BI is turning 10, and we’re marking the occasion with a special community challenge. Use your creativity to tell a story, uncover trends, or highlight something unexpected.
Get started- Power BI forums
- Get Help with Power BI
- Desktop
- Service
- Report Server
- Power Query
- Mobile Apps
- Developer
- DAX Commands and Tips
- Custom Visuals Development Discussion
- Health and Life Sciences
- Power BI Spanish forums
- Translated Spanish Desktop
- Training and Consulting
- Instructor Led Training
- Dashboard in a Day for Women, by Women
- Galleries
- Webinars and Video Gallery
- Data Stories Gallery
- Themes Gallery
- Contests Gallery
- Quick Measures Gallery
- Notebook Gallery
- Translytical Task Flow Gallery
- R Script Showcase
- Ideas
- Custom Visuals Ideas (read-only)
- Issues
- Issues
- Events
- Upcoming Events
Join us for an expert-led overview of the tools and concepts you'll need to become a Certified Power BI Data Analyst and pass exam PL-300. Register now.
- Power BI forums
- Forums
- Get Help with Power BI
- DAX Commands and Tips
- Re: Standard Deviation from 4 measured columns.......
- Subscribe to RSS Feed
- Mark Topic as New
- Mark Topic as Read
- Float this Topic for Current User
- Bookmark
- Subscribe
- Printer Friendly Page
- Mark as New
- Bookmark
- Subscribe
- Mute
- Subscribe to RSS Feed
- Permalink
- Report Inappropriate Content
Standard Deviation from 4 measured columns.... DARN!
Hi all!
I've researched so many sites (and previous answers) concerning computing standard deviation in PowerBI. I never knew it would be so difficult for me to do since Excel makes it SIMPLE!
I have a matrix table that I want to resemble an excel table. The data shown are all aggregate values compiled from individual records (with some duplicates). All columns are measures.
It is important for the pivot to remain and that I only calculate the current month for each year. For an example, I want to calculate March for the current year and March for the previous 5 years (2022 - 2017). While the STDEVX.P function is fairly simple, I need it to only reference my previous 5 year columns (2017-2021). When I use the function, it references EVERYTHING since I don't have a DAX formula to add in the caveats.
If my vision is possible, please help me out or let me know of alternatives. I will give kudos and I don't mind reading recommendations!
Solved! Go to Solution.
- Mark as New
- Bookmark
- Subscribe
- Mute
- Subscribe to RSS Feed
- Permalink
- Report Inappropriate Content
Hi Demdej
I have just realised that you wish to measure the standard deviation at a yearly granularity, not at the granularity of the data within. So over 5 data points
Ie the calculation would look like this if we were to draw it out:
SQRT( ( (2016prod-avg)²+(2017prod-avg)²+....+(2020prod-avg)²)/5 )
What we need for this are the "aggregateX" functions. These are probably easier to understand if you research "sumX" and "averageX" as they are better documented & used.
Essentially, these functions will allow you to iterate across rows that you define:
eg
AverageX( Values([customerID]), sum(Sales)) will group by customer, calculate the sales for each then work out the average of all of those results. Giving you the average sales per customer.
In your example we are going to use
Year STDEV = STDEVX.P( VALUES(APY[Crop_Year]), [x years production])Where
x years production = CALCULATE(sum(APY[Production]),FILTER(APY,APY[Crop_Year]>= 2016))
Plugging this into the table gives the result as manually calculated in excel.
Result in PBI:
calculation in Excel:
Pi
- Mark as New
- Bookmark
- Subscribe
- Mute
- Subscribe to RSS Feed
- Permalink
- Report Inappropriate Content
Hi Demdej, it seems like you need the CALCULATE() function.
CALCULATE gives you the flexibility to apply a filter to any measure and change the context in which it is executed.
For example. I have a data set with crops, and production amounts.
To work out the total production for all years >2016:
The first parameter is the measure we want to use, the second is the filter. Very simple:
x years production Total = CALCULATE(sum(APY[Production]),APY[Crop_Year]>= 2016)So whereever we use this measure, it will ignore the year and give us total prod after 2016:
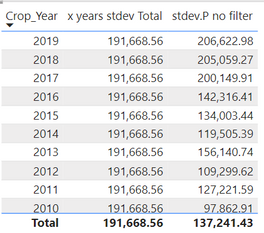
You can see here it is just adding up the sum of production from years 2016+ and putting it in every cell, regardless of the year that the row is for!
Calculate also offers many options for types of filters - see reference here: https://learn.microsoft.com/en-us/dax/filter-functions-dax
If we want to only include the years 2016+ but also filter for the individual year, we can create this expression:
x years production = CALCULATE(sum(APY[Production]),FILTER(APY,APY[Crop_Year]>= 2016))
So it depends on exactly what you will be doing with Standard deviation, what filters you want to impact it etc, but at the simplest level some variation of this expression is what you need:
x years stdev Total = CALCULATE(STDEV.P(APY[Production]),APY[Crop_Year]>= 2016)
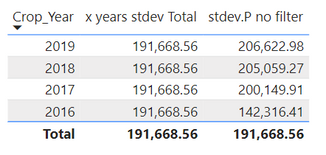
Let's perform a quick check by filtering the year and make sure it is correct:

The final table
Now we can apply this to the final table. Unfortunately, we cannot combine a pivot and a straight table in one, so I have used a straight table and created a measure per each year to get round this issue:

HTH,
Pi
- Mark as New
- Bookmark
- Subscribe
- Mute
- Subscribe to RSS Feed
- Permalink
- Report Inappropriate Content
Thanks so much for the thorough explanation and examples. They are always so helpful.
The fact that we can't use a pivot table to illustrate the st.dev is difficult because, like you, I created a measure for each year, but I still could not get an accurate SD.
For some reason, it's the same for you:
I just double check my data in Excel, because I'm far better at Excel than PowerBI. Since the column thing is such an issue, I decided to put my dates all in one column, but I STILL can't get an accurate count.
I'm truly stomped. 😞
- Mark as New
- Bookmark
- Subscribe
- Mute
- Subscribe to RSS Feed
- Permalink
- Report Inappropriate Content
Hi Demdej
I have just realised that you wish to measure the standard deviation at a yearly granularity, not at the granularity of the data within. So over 5 data points
Ie the calculation would look like this if we were to draw it out:
SQRT( ( (2016prod-avg)²+(2017prod-avg)²+....+(2020prod-avg)²)/5 )
What we need for this are the "aggregateX" functions. These are probably easier to understand if you research "sumX" and "averageX" as they are better documented & used.
Essentially, these functions will allow you to iterate across rows that you define:
eg
AverageX( Values([customerID]), sum(Sales)) will group by customer, calculate the sales for each then work out the average of all of those results. Giving you the average sales per customer.
In your example we are going to use
Year STDEV = STDEVX.P( VALUES(APY[Crop_Year]), [x years production])Where
x years production = CALCULATE(sum(APY[Production]),FILTER(APY,APY[Crop_Year]>= 2016))
Plugging this into the table gives the result as manually calculated in excel.
Result in PBI:
calculation in Excel:
Pi
- Mark as New
- Bookmark
- Subscribe
- Mute
- Subscribe to RSS Feed
- Permalink
- Report Inappropriate Content
- Mark as New
- Bookmark
- Subscribe
- Mute
- Subscribe to RSS Feed
- Permalink
- Report Inappropriate Content
You're welcome - Glad it worked!
Helpful resources

Join our Fabric User Panel
This is your chance to engage directly with the engineering team behind Fabric and Power BI. Share your experiences and shape the future.

Power BI Monthly Update - June 2025
Check out the June 2025 Power BI update to learn about new features.

| User | Count |
|---|---|
| 11 | |
| 11 | |
| 10 | |
| 9 | |
| 8 |
| User | Count |
|---|---|
| 17 | |
| 12 | |
| 11 | |
| 11 | |
| 10 |


