Fabric Data Days starts November 4th!
Advance your Data & AI career with 50 days of live learning, dataviz contests, hands-on challenges, study groups & certifications and more!
Get registered- Power BI forums
- Get Help with Power BI
- Desktop
- Service
- Report Server
- Power Query
- Mobile Apps
- Developer
- DAX Commands and Tips
- Custom Visuals Development Discussion
- Health and Life Sciences
- Power BI Spanish forums
- Translated Spanish Desktop
- Training and Consulting
- Instructor Led Training
- Dashboard in a Day for Women, by Women
- Galleries
- Data Stories Gallery
- Themes Gallery
- Contests Gallery
- QuickViz Gallery
- Quick Measures Gallery
- Visual Calculations Gallery
- Notebook Gallery
- Translytical Task Flow Gallery
- TMDL Gallery
- R Script Showcase
- Webinars and Video Gallery
- Ideas
- Custom Visuals Ideas (read-only)
- Issues
- Issues
- Events
- Upcoming Events
Get Fabric Certified for FREE during Fabric Data Days. Don't miss your chance! Request now
- Power BI forums
- Forums
- Get Help with Power BI
- DAX Commands and Tips
- Re: Showing 0 instead of nothing (null), adding CO...
- Subscribe to RSS Feed
- Mark Topic as New
- Mark Topic as Read
- Float this Topic for Current User
- Bookmark
- Subscribe
- Printer Friendly Page
- Mark as New
- Bookmark
- Subscribe
- Mute
- Subscribe to RSS Feed
- Permalink
- Report Inappropriate Content
Showing 0 instead of nothing (null), adding COALESCE breaks filtering (hierarchy)
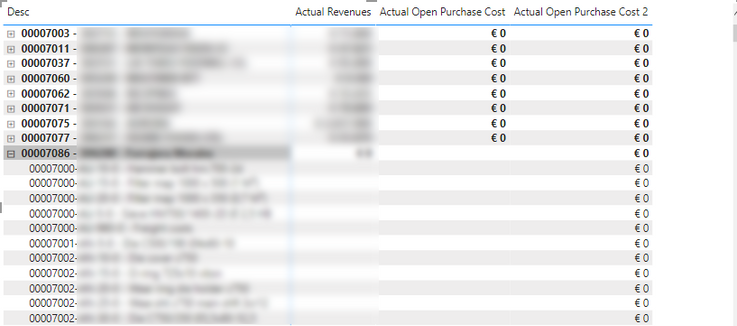
I have a Measure in a matrix showing a mix of actual values and (null) values. Reason is that not for all lines the metric exists.
The matrix also has a hiearchy: Customer Transation - Customer Transaction Line
Desire is to replace (null) with 0. So I added COALESCE to the defintion in a new measure

- Mark as New
- Bookmark
- Subscribe
- Mute
- Subscribe to RSS Feed
- Permalink
- Report Inappropriate Content
It would be better to select both Product and Description columns from Dim table into the matrix as Rows fields. Then you will not have this problem.
The cause is the cross-filter direction of the relationship between Dim table and Fact table. In below image, you have a single cross-filter direction relationship from Dim Prod to Fact table. This means that Dim Prod table can filter Fact table, but Fact table cannot filter Dim Prod table. When you put ProductName from Fact table into the matrix, and put Description from Dim table into it at a lower hiearchy level than ProductName, ProductName is not able to filter Description. As a result, it display all rows.
Best Regards,
Community Support Team _ Jing
If this post helps, please Accept it as Solution to help other members find it.
- Mark as New
- Bookmark
- Subscribe
- Mute
- Subscribe to RSS Feed
- Permalink
- Report Inappropriate Content
Hi @v-jingzhang,
I tried changing the cross-filter direction from single->both in the model but that does not help. Am I doing something wrong?
We have a datawarehouse which is set up with Fact and Dimension tables in which dimensions are coupled via star schema or snowflake. The fact tables only contain metrics and surrogate keys to the dimensions. Adding chracteristics of dimensions to the fact table is no option.
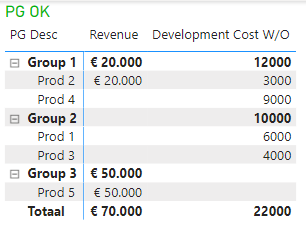
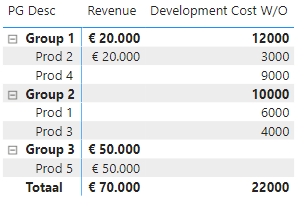
In the example I added a Dim ProductGroup which is also coupled to the fact table. This represents my situation better.
The hiearchy is OK untill the measure with coalesce function or + 0 is added.
It seems that using coalesce or +0 creates a value for every possible combination disregarding the combinations in the data or relations in the model. Somehow is logical as there is always a value, but I am wondering what the use case is for this behaviour.
Workaround for this is to create an additional measure that determines if all values used are blank. This meaure can then be used to filter out the combinations where all values are blank. But this is can make maintenance harder and time consuming. E.g. when adding or removing a measure to a visual this extra measure needs to be updated too.
See Example issue NULL and COALESCE 2.pbix for used examples and measures.
Is there a simpler solution that only replaces the blanks with 0?
- Mark as New
- Bookmark
- Subscribe
- Mute
- Subscribe to RSS Feed
- Permalink
- Report Inappropriate Content
Hello:
I think you can just add + 0 to the end of your measure and you will get a 0 vs. null.
I hope this helps!
- Mark as New
- Bookmark
- Subscribe
- Mute
- Subscribe to RSS Feed
- Permalink
- Report Inappropriate Content
Hi,
Unfornunately that gives the same result.
I tried to reproduce in a simple example: Example issue NULL and COALESCE.pbix
It looks that when the hiearchy in de matrix has fields from more than two other (Dim) tables the hierachy shows alle values instead of values filtered by the hierarchy.
Helpful resources

Fabric Data Days
Advance your Data & AI career with 50 days of live learning, contests, hands-on challenges, study groups & certifications and more!

Power BI Monthly Update - October 2025
Check out the October 2025 Power BI update to learn about new features.

| User | Count |
|---|---|
| 8 | |
| 7 | |
| 6 | |
| 5 | |
| 4 |
| User | Count |
|---|---|
| 25 | |
| 9 | |
| 8 | |
| 8 | |
| 8 |


