New Offer! Become a Certified Fabric Data Engineer
Check your eligibility for this 50% exam voucher offer and join us for free live learning sessions to get prepared for Exam DP-700.
Get Started- Power BI forums
- Get Help with Power BI
- Desktop
- Service
- Report Server
- Power Query
- Mobile Apps
- Developer
- DAX Commands and Tips
- Custom Visuals Development Discussion
- Health and Life Sciences
- Power BI Spanish forums
- Translated Spanish Desktop
- Training and Consulting
- Instructor Led Training
- Dashboard in a Day for Women, by Women
- Galleries
- Community Connections & How-To Videos
- COVID-19 Data Stories Gallery
- Themes Gallery
- Data Stories Gallery
- R Script Showcase
- Webinars and Video Gallery
- Quick Measures Gallery
- 2021 MSBizAppsSummit Gallery
- 2020 MSBizAppsSummit Gallery
- 2019 MSBizAppsSummit Gallery
- Events
- Ideas
- Custom Visuals Ideas
- Issues
- Issues
- Events
- Upcoming Events
Don't miss out! 2025 Microsoft Fabric Community Conference, March 31 - April 2, Las Vegas, Nevada. Use code MSCUST for a $150 discount. Prices go up February 11th. Register now.
- Power BI forums
- Forums
- Get Help with Power BI
- DAX Commands and Tips
- Running Total Across Months
- Subscribe to RSS Feed
- Mark Topic as New
- Mark Topic as Read
- Float this Topic for Current User
- Bookmark
- Subscribe
- Printer Friendly Page
- Mark as New
- Bookmark
- Subscribe
- Mute
- Subscribe to RSS Feed
- Permalink
- Report Inappropriate Content
Running Total Across Months
Hi all,
I've tried searching through previous threads but have come up short with a solution that seems to work in my case.
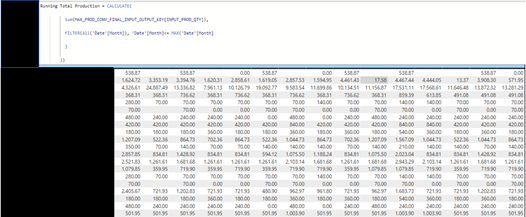
I have material id's as rows and monthly production as columns. I would like the production to be cumulative across the months rather than as production by month as seen above. The formula I tried in the box above does not seem to work as expected.
Thank you and would appreciate any help.
- Mark as New
- Bookmark
- Subscribe
- Mute
- Subscribe to RSS Feed
- Permalink
- Report Inappropriate Content
@Anonymous , if you need over all cumm
Cumm Sales = CALCULATE(SUM(Sales[Sales Amount]),filter(all('Date'),'Date'[date] <=max('Date'[date])))
Cumm Sales = CALCULATE(SUM(Sales[Sales Amount]),filter(allselected('Date'),'Date'[date] <=max('Date'[date])))
only till month level
MTD Sales = CALCULATE(SUM(Sales[Sales Amount]),DATESMTD('Date'[Date]))
QTR
QTD Sales = CALCULATE(SUM(Sales[Sales Amount]),DATESQTD('Date'[Date]))
Yearly
YTD Sales = CALCULATE(SUM(Sales[Sales Amount]),DATESYTD('Date'[Date]))
At the Microsoft Analytics Community Conference, global leaders and influential voices are stepping up to share their knowledge and help you master the latest in Microsoft Fabric, Copilot, and Purview. ✨
️ November 12th-14th, 2024
Online Event
Register Here
Helpful resources

Join us at the Microsoft Fabric Community Conference
March 31 - April 2, 2025, in Las Vegas, Nevada. Use code MSCUST for a $150 discount!

Power BI Monthly Update - January 2025
Check out the January 2025 Power BI update to learn about new features in Reporting, Modeling, and Data Connectivity.

| User | Count |
|---|---|
| 15 | |
| 11 | |
| 8 | |
| 8 | |
| 8 |
| User | Count |
|---|---|
| 22 | |
| 13 | |
| 11 | |
| 10 | |
| 10 |

