Join us at FabCon Vienna from September 15-18, 2025
The ultimate Fabric, Power BI, SQL, and AI community-led learning event. Save €200 with code FABCOMM.
Get registered- Power BI forums
- Get Help with Power BI
- Desktop
- Service
- Report Server
- Power Query
- Mobile Apps
- Developer
- DAX Commands and Tips
- Custom Visuals Development Discussion
- Health and Life Sciences
- Power BI Spanish forums
- Translated Spanish Desktop
- Training and Consulting
- Instructor Led Training
- Dashboard in a Day for Women, by Women
- Galleries
- Data Stories Gallery
- Themes Gallery
- Contests Gallery
- Quick Measures Gallery
- Notebook Gallery
- Translytical Task Flow Gallery
- TMDL Gallery
- R Script Showcase
- Webinars and Video Gallery
- Ideas
- Custom Visuals Ideas (read-only)
- Issues
- Issues
- Events
- Upcoming Events
Enhance your career with this limited time 50% discount on Fabric and Power BI exams. Ends August 31st. Request your voucher.
- Power BI forums
- Forums
- Get Help with Power BI
- DAX Commands and Tips
- Re: RANKX when “Product” appears on multiple rows?
- Subscribe to RSS Feed
- Mark Topic as New
- Mark Topic as Read
- Float this Topic for Current User
- Bookmark
- Subscribe
- Printer Friendly Page
- Mark as New
- Bookmark
- Subscribe
- Mute
- Subscribe to RSS Feed
- Permalink
- Report Inappropriate Content
RANKX when “Product” appears on multiple rows?
How do I get RANKX to work on filtered data source where same product appears on multiple rows?
In this Excel example, the data loads easily into a pivot table for the desired result.
As you can see, Banana ranked #2 in the WEST, but #3 in the EAST.
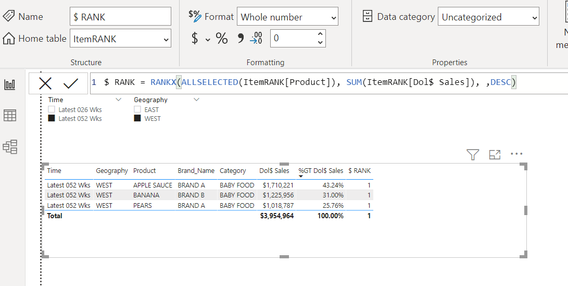
What am I missing in my RANKX calculated measure?
I want to be able to filter on different Time Period, different Geography, different Brands and rank to change based on slicer/filtering. Thanks.
Solved! Go to Solution.
- Mark as New
- Bookmark
- Subscribe
- Mute
- Subscribe to RSS Feed
- Permalink
- Report Inappropriate Content
- Mark as New
- Bookmark
- Subscribe
- Mute
- Subscribe to RSS Feed
- Permalink
- Report Inappropriate Content
Hi FreemanZ
That helped, but the rank result is not correct when filtered or unfiltered.
- Mark as New
- Bookmark
- Subscribe
- Mute
- Subscribe to RSS Feed
- Permalink
- Report Inappropriate Content
- Mark as New
- Bookmark
- Subscribe
- Mute
- Subscribe to RSS Feed
- Permalink
- Report Inappropriate Content
- Mark as New
- Bookmark
- Subscribe
- Mute
- Subscribe to RSS Feed
- Permalink
- Report Inappropriate Content
Hello @tarmerj1
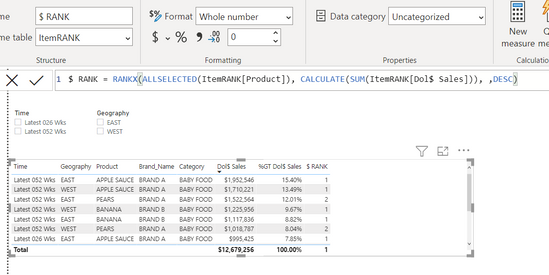
THANK YOU! Both of your options work, but option 1 is my desired result.
I am going to use:
$ RANK = RANKX(ALLSELECTED(ItemRANK), CALCULATE(SUM(ItemRANK[Dol$ Sales])), ,DESC)
The fix was to remove [Product] from ALLSELECTED. Thanks @tarmerj1 and @FreemanZ, much appreciated.
- Mark as New
- Bookmark
- Subscribe
- Mute
- Subscribe to RSS Feed
- Permalink
- Report Inappropriate Content
- Mark as New
- Bookmark
- Subscribe
- Mute
- Subscribe to RSS Feed
- Permalink
- Report Inappropriate Content
hi @Kirk_1
try like:
$ RANK = RANKX(ALLSELECTED(ItemRANK[Product]), CALCULATE(SUM(ItemRANK[Dol$ Sales])), ,DESC)
Helpful resources
| User | Count |
|---|---|
| 27 | |
| 12 | |
| 8 | |
| 8 | |
| 5 |
| User | Count |
|---|---|
| 31 | |
| 15 | |
| 12 | |
| 7 | |
| 6 |


