FabCon is coming to Atlanta
Join us at FabCon Atlanta from March 16 - 20, 2026, for the ultimate Fabric, Power BI, AI and SQL community-led event. Save $200 with code FABCOMM.
Register now!- Power BI forums
- Get Help with Power BI
- Desktop
- Service
- Report Server
- Power Query
- Mobile Apps
- Developer
- DAX Commands and Tips
- Custom Visuals Development Discussion
- Health and Life Sciences
- Power BI Spanish forums
- Translated Spanish Desktop
- Training and Consulting
- Instructor Led Training
- Dashboard in a Day for Women, by Women
- Galleries
- Data Stories Gallery
- Themes Gallery
- Contests Gallery
- Quick Measures Gallery
- Notebook Gallery
- Translytical Task Flow Gallery
- TMDL Gallery
- R Script Showcase
- Webinars and Video Gallery
- Ideas
- Custom Visuals Ideas (read-only)
- Issues
- Issues
- Events
- Upcoming Events
To celebrate FabCon Vienna, we are offering 50% off select exams. Ends October 3rd. Request your discount now.
- Power BI forums
- Forums
- Get Help with Power BI
- DAX Commands and Tips
- Re: Not able to get totals in Power BI
- Subscribe to RSS Feed
- Mark Topic as New
- Mark Topic as Read
- Float this Topic for Current User
- Bookmark
- Subscribe
- Printer Friendly Page
- Mark as New
- Bookmark
- Subscribe
- Mute
- Subscribe to RSS Feed
- Permalink
- Report Inappropriate Content
Not able to get totals in Power BI
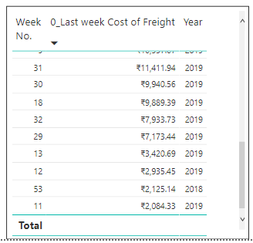
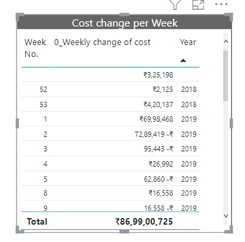
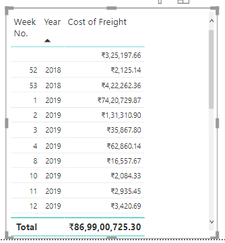
I want to understand, why I am not getting totals in some senarios in the table. Why does this happen and what I must do to avoid this?
The measures I used are:
1.


Solved! Go to Solution.
- Mark as New
- Bookmark
- Subscribe
- Mute
- Subscribe to RSS Feed
- Permalink
- Report Inappropriate Content
Hi @Anonymous
In the Total row there are no filters applied. Your SELECTEDVALUE expressions will thus return blank, since there is more than one value in the specified column (see https://dax.guide/selectedvalue/ )
You will either have to update the code of the meausures to take this into account or create another one based on what you have. This is assuming you have 'dDate'[Week No.] and 'dDate'[Year] in the rows of your visual:
0_Last week Cost of Freight_TOTAL =
SUMX(SUMMARIZE('dDate', 'dDate'[Week No.], 'dDate'[Year]), [0_Last week Cost of Freight])
Please mark the question solved when done and consider giving kudos if posts are helpful.
Cheers
- Mark as New
- Bookmark
- Subscribe
- Mute
- Subscribe to RSS Feed
- Permalink
- Report Inappropriate Content
The same problem still exist while using a different formula, I want to understand why does this happen.
1. _Loadability by cases per trips =
CALCULATE(
DIVIDE([0_Total Volume Shipped by Cases],[0_Total Shipments],BLANK())
)
2. last month loadability BCPT =
CALCULATE(
[ _Loadability by cases per trips ],DATEADD(dDate[Date],-1,MONTH))
3. Trips saved VS last Month =
CALCULATE(
IF([last month loadability BCPT]=0,BLANK(),
CALCULATE(
(DIVIDE
([0_Total Volume Shipped by Cases],[last month loadability BCPT],BLANK())-[0_Total Shipments])
)))
- Mark as New
- Bookmark
- Subscribe
- Mute
- Subscribe to RSS Feed
- Permalink
- Report Inappropriate Content


