FabCon is coming to Atlanta
Join us at FabCon Atlanta from March 16 - 20, 2026, for the ultimate Fabric, Power BI, AI and SQL community-led event. Save $200 with code FABCOMM.
Register now!- Power BI forums
- Get Help with Power BI
- Desktop
- Service
- Report Server
- Power Query
- Mobile Apps
- Developer
- DAX Commands and Tips
- Custom Visuals Development Discussion
- Health and Life Sciences
- Power BI Spanish forums
- Translated Spanish Desktop
- Training and Consulting
- Instructor Led Training
- Dashboard in a Day for Women, by Women
- Galleries
- Data Stories Gallery
- Themes Gallery
- Contests Gallery
- QuickViz Gallery
- Quick Measures Gallery
- Visual Calculations Gallery
- Notebook Gallery
- Translytical Task Flow Gallery
- TMDL Gallery
- R Script Showcase
- Webinars and Video Gallery
- Ideas
- Custom Visuals Ideas (read-only)
- Issues
- Issues
- Events
- Upcoming Events
Get Fabric Certified for FREE during Fabric Data Days. Don't miss your chance! Request now
- Power BI forums
- Forums
- Get Help with Power BI
- DAX Commands and Tips
- Inaccurate Cumulative Sum
- Subscribe to RSS Feed
- Mark Topic as New
- Mark Topic as Read
- Float this Topic for Current User
- Bookmark
- Subscribe
- Printer Friendly Page
- Mark as New
- Bookmark
- Subscribe
- Mute
- Subscribe to RSS Feed
- Permalink
- Report Inappropriate Content
Inaccurate Cumulative Sum
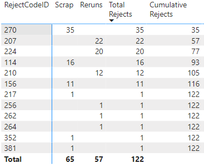
Hi, having trouble getting the cumulative sum accurate. Filter issue?
Setup:
Two tables: 'Rerun'[RejectCodeID];[Units] and 'Scrap'[RejectCodeID]; [Units].
One to many: Dimension table 'RejectCode'[RejectCodeID]
The Dax measure I use calculates the cumulative sum of rejects incorrectly after 116.
It sould been 35, 57, 77, 93, 105, 117, 118, 119, 120, 121, 122.
Cumulative Rejects =

VAR TotalRejects = [Reruns] + [Scrap]

Return

SUMX(
    FILTER(
        SUMMARIZE( ALLSELECTED('RejectCode'), 'RejectCode'[RejectCodeID],
        "Rejects", [Scrap] + [Reruns] ),
         [Rejects] >= TotalRejects ),
         [Rejects] )
Any ideas on what can be wrong?
Thanks!
Solved! Go to Solution.
- Mark as New
- Bookmark
- Subscribe
- Mute
- Subscribe to RSS Feed
- Permalink
- Report Inappropriate Content
Hi @Salle ,
I'm suspecting you're trying to accumulate based on total largest to smallest, and you can check the results as follows:
Rank =
VAR _1=RANKX('Table (2)','Table (2)'[Total],,DESC,Dense)

VAR _2 =
RANKX('Table (2)','Table (2)'[RejectCodeID],,ASC,Dense)/ POWER(10,ROUNDDOWN(COUNT('Table (2)'[RejectCodeID])/10,0)+1)
RETURN
_1 + _2

Cumulative Rejects =
VAR TotalRejects = [Re] + [Sc]
Return
CALCULATE(
    SUM('Table (2)'[Total]),
    FILTER(
        ALLSELECTED('Table (2)'),
        'Table (2)'[Rank] <= MAX('Table (2)'[Rank])
    )
)
An attachment for your reference. Hope it helps!
Best regards,
Community Support Team_ Scott Chang
If this post helps then please consider Accept it as the solution to help the other members find it more quickly.
- Mark as New
- Bookmark
- Subscribe
- Mute
- Subscribe to RSS Feed
- Permalink
- Report Inappropriate Content
Hi @Salle
Try this measure ,
Measure=Calculate (Rejects+Scraps,Filter(All(Dimdate),Date column<=Max(Date))
Thanks,
Thennarasu R
If this post helps then please consider accepeted the solution to help the other members find it more quickly.
- Mark as New
- Bookmark
- Subscribe
- Mute
- Subscribe to RSS Feed
- Permalink
- Report Inappropriate Content
It does not work.
I want to plot a pareto chart with RejectionCodeID as bars and Pareto curve as line. But first the cumulative sum must be accurate.
Helpful resources

Power BI Monthly Update - November 2025
Check out the November 2025 Power BI update to learn about new features.

Fabric Data Days
Advance your Data & AI career with 50 days of live learning, contests, hands-on challenges, study groups & certifications and more!

| User | Count |
|---|---|
| 11 | |
| 9 | |
| 9 | |
| 6 | |
| 6 |
| User | Count |
|---|---|
| 26 | |
| 22 | |
| 19 | |
| 17 | |
| 10 |


