FabCon is coming to Atlanta
Join us at FabCon Atlanta from March 16 - 20, 2026, for the ultimate Fabric, Power BI, AI and SQL community-led event. Save $200 with code FABCOMM.
Register now!- Power BI forums
- Get Help with Power BI
- Desktop
- Service
- Report Server
- Power Query
- Mobile Apps
- Developer
- DAX Commands and Tips
- Custom Visuals Development Discussion
- Health and Life Sciences
- Power BI Spanish forums
- Translated Spanish Desktop
- Training and Consulting
- Instructor Led Training
- Dashboard in a Day for Women, by Women
- Galleries
- Data Stories Gallery
- Themes Gallery
- Contests Gallery
- Quick Measures Gallery
- Visual Calculations Gallery
- Notebook Gallery
- Translytical Task Flow Gallery
- TMDL Gallery
- R Script Showcase
- Webinars and Video Gallery
- Ideas
- Custom Visuals Ideas (read-only)
- Issues
- Issues
- Events
- Upcoming Events
Calling all Data Engineers! Fabric Data Engineer (Exam DP-700) live sessions are back! Starting October 16th. Sign up.
- Power BI forums
- Forums
- Get Help with Power BI
- DAX Commands and Tips
- Identify Outliers
- Subscribe to RSS Feed
- Mark Topic as New
- Mark Topic as Read
- Float this Topic for Current User
- Bookmark
- Subscribe
- Printer Friendly Page
- Mark as New
- Bookmark
- Subscribe
- Mute
- Subscribe to RSS Feed
- Permalink
- Report Inappropriate Content
Identify Outliers
Hello,
My ultimate goal is to create a measure that identifies if a data point is an outlier. I want to group the data points by Classification Criteria, Continent, and Fiscal Quarter. I understand how to do this for the whole data set, but once filters are applied the values are no longer correct.
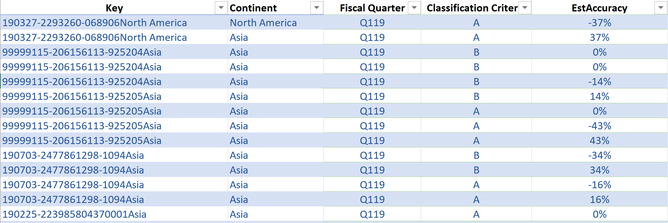
My data structure consists of Estimation Accuracy (Value), a Key, Fiscal Quarters, and a Classification Criteria.
Table Name: Quotes

Thus far I have created measures for Mean, Standard Deviation, Standard Error of the Mean, Upper Limit, Lower Limit, and Outlier.
However, I am not confident the measures are correct. I believe my problem is the Mean calculation, it's not grouping by the Fiscal Quarter and Continent.
Mean:
Mean =
VAR yy = FIRSTNONBLANK(Quotes[FiscalQtr],1)
VAR xx = GROUPBY(Quotes,Quotes[Continent])
RETURN
    CALCULATE(
        AVERAGE(Quotes[EstAccuracy]),
        ALL(Quotes[FiscalQtr]),
        Quotes[FiscalQtr] = yy,
        Quotes[Continent] = xx)
I would like the flexibility to change the filters on the data, example view mean by Classification Criteria for Q3 only. How can I write this into a measure so it is flexible enough?
Standard Deviation:
Std dev =
CALCULATE(
    STDEV.P(Quotes[EstAccuracy]))
Standard Error:
Std Error of the Mean =
[Std dev] / SQRT(COUNTROWS(Quotes))
Confidence Interval
Confidence Interval = 1.96
Standard Error of the Mean:
Std Error of the Mean =
[Std dev] / SQRT(COUNTROWS(Quotes))
Upper Limit:
Upper Limit_2 =
[Mean] + ([Confidence Interval]*[Std Error of the Mean])
Lower Limit:
Lower Limit_2 =
[Mean] - ([Confidence Interval]* [Std Error of the Mean])
Outlier Identification:
Outlier_2 =
IF(
    AND(
        FIRSTNONBLANK(Quotes[EstAccuracy],1) <= [Upper Limit_2],
        FIRSTNONBLANK(Quotes[EstAccuracy],1) >= [Lower Limit_2]),
        "Within",
        "Outside"
)
The Outlier attribute is NOT correct. Is there a better way to do this? I want the measures to hold when filters are applied. 
My ultimate goal is to have a table with all identified outliers present, I haven't been able to get this to work.
Any help is greatly appreciated!
Helpful resources

FabCon Global Hackathon
Join the Fabric FabCon Global Hackathon—running virtually through Nov 3. Open to all skill levels. $10,000 in prizes!

Power BI Monthly Update - October 2025
Check out the October 2025 Power BI update to learn about new features.

| User | Count |
|---|---|
| 10 | |
| 8 | |
| 6 | |
| 4 | |
| 3 |
