FabCon is coming to Atlanta
Join us at FabCon Atlanta from March 16 - 20, 2026, for the ultimate Fabric, Power BI, AI and SQL community-led event. Save $200 with code FABCOMM.
Register now!- Power BI forums
- Get Help with Power BI
- Desktop
- Service
- Report Server
- Power Query
- Mobile Apps
- Developer
- DAX Commands and Tips
- Custom Visuals Development Discussion
- Health and Life Sciences
- Power BI Spanish forums
- Translated Spanish Desktop
- Training and Consulting
- Instructor Led Training
- Dashboard in a Day for Women, by Women
- Galleries
- Data Stories Gallery
- Themes Gallery
- Contests Gallery
- QuickViz Gallery
- Quick Measures Gallery
- Visual Calculations Gallery
- Notebook Gallery
- Translytical Task Flow Gallery
- TMDL Gallery
- R Script Showcase
- Webinars and Video Gallery
- Ideas
- Custom Visuals Ideas (read-only)
- Issues
- Issues
- Events
- Upcoming Events
The Power BI Data Visualization World Championships is back! Get ahead of the game and start preparing now! Learn more
- Power BI forums
- Forums
- Get Help with Power BI
- DAX Commands and Tips
- How to make a slicer for parameter which takes on ...
- Subscribe to RSS Feed
- Mark Topic as New
- Mark Topic as Read
- Float this Topic for Current User
- Bookmark
- Subscribe
- Printer Friendly Page
- Mark as New
- Bookmark
- Subscribe
- Mute
- Subscribe to RSS Feed
- Permalink
- Report Inappropriate Content
How to make a slicer for parameter which takes on average value of columns
Hi,
I am transitioning from Tableau to Powerbi and am stuck on a problem.
I made a parameter that takes the average values of certain columns to filter visuals.
Please have a look at the below pictures to understand better.
I want to replicate the same in Powerbi and cannot do so by making a parameter.
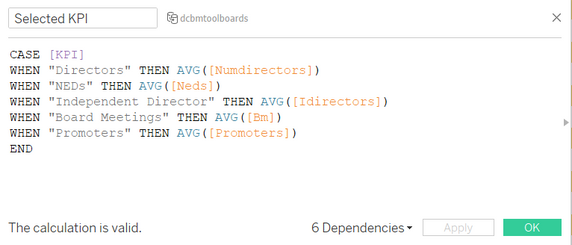
This is the KPI Parameter that I created in Tableau
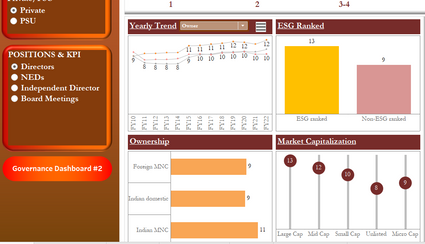
How it is applied in creating a chart in Tableau
The parameter in action:
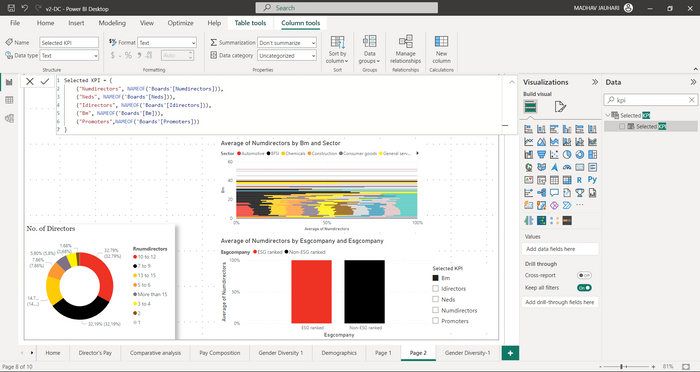
Please help with any hints and suggestions that I can use to resolve this. Currently, this is what I did to replicate:
Not able to take averages here.
- Mark as New
- Bookmark
- Subscribe
- Mute
- Subscribe to RSS Feed
- Permalink
- Report Inappropriate Content
Hey, thank you for your response. I did the same but I need averages of the values that are going to be put as parameter fields. I am not able to do that.
Can you help me in this aspect?
- Mark as New
- Bookmark
- Subscribe
- Mute
- Subscribe to RSS Feed
- Permalink
- Report Inappropriate Content
@imaindia You want to select any slicer and that slicer value passes in the parameter? if I am not wrong.
- Mark as New
- Bookmark
- Subscribe
- Mute
- Subscribe to RSS Feed
- Permalink
- Report Inappropriate Content
Let me explain a bit more clearly, apologies if I was not clear.
I have a dashboard with multiple visuals which are connected to this parameter. So for example
In this dashboard I want these 2 visuals to be controlled with the help of the parameter selected KPI
for eg when I select numdirectors the average of numdirectors should be taken for the visuals.
similarly when promoters is selected both the visuals now show value with average of promoters.
I hope I am able to convey the query clearly now.
- Mark as New
- Bookmark
- Subscribe
- Mute
- Subscribe to RSS Feed
- Permalink
- Report Inappropriate Content
@imaindia you can go with the field parameter in power bi. for more information please refer below link. Thank YOU!!!
https://youtu.be/-nqEv2YXLsU
ELSE
Measure =
SWITCH(
SELECTEDVALUE(Table[Column]),
"A",[Measure1],
"B",[Measure2],
Blank()
)
Helpful resources

Power BI Monthly Update - November 2025
Check out the November 2025 Power BI update to learn about new features.

Fabric Data Days
Advance your Data & AI career with 50 days of live learning, contests, hands-on challenges, study groups & certifications and more!

| User | Count |
|---|---|
| 19 | |
| 10 | |
| 9 | |
| 4 | |
| 4 |
| User | Count |
|---|---|
| 31 | |
| 31 | |
| 20 | |
| 12 | |
| 12 |


